BTC USD 75,904.4 Gold USD 4,338.25
Time now: Jun 1, 12:00 AM

Trading Room: European Session

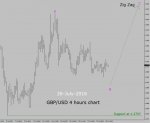
GBP/USD 4 hours chart Buy Setup

Hello Traders

This is an update about GBP/USD 4 hours chart Buy trade setup.

Trend is bullish in 4 hours time frame. Key support is present at 1.2797 price level. In last few trading days, GBP/USD currency pair is sliding down but in a corrective wave fashion, Wave B. I do expect a bullish price action in coming trading days.

The trend is still up and we should only look for long trades. However; a bearish break down in market action below 1.2797 price level will fail bullish outlook and in such case; I would prefer to stay out of the market and re-analyze price action in GBP/USD 4 hours chart.

See the attached screen shot image of GBP/USD 4 hour chart
 

Attachments

  • 28.7 KB Views: 73
USD/CHF 1 hour chart - Sell Setup

Hello Traders

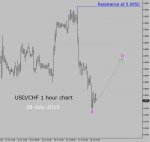
This is an update about USD/CHF 1 hour chart sell trade setup.

Trend is down in 1 hour chart. Key resistance level is present at 0.9950 price level. In last few trading days, USD/CHF currency pair is sliding down in a corrective wave pattern.

The bearish leg is Wave A. Now, I do expect a bullish leg - Wave B which offers a possible sell trade setup in coming trading days.

As the trend is still bearish and we should only look for short trades. However; a bullish break down in market action above 0.9950 price level will fail bearish Elliott wave forecast and in such case; I would prefer to stay out of the market and re-analyze price action in USD/CHF 1 hour time frame.

See the attached screen shot image of USD/CHF 1 hour chart
 

Attachments

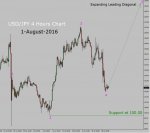
USD/JPY Buy Trade setup in 4 hours chart

Trend is bullish in USD/JPY currency pair, 4 hour time frame. As I have suggested past week during my daily Live trading room session, market is falling down on a short term basis to complete bearish wave 4 leg which is part of a larger version of a Bullish Expanding Leading Diagonal pattern and traders should look for a short trade. So, all those Forex traders who have followed the analysis have made the right decision as the price has descended. Strong key support level is present at 100.00 price level which is also a round number.

Be sure to check out daily Forex market updates via Live Trading Room. In my judgement, round number support usually works quite well and price action in USD/JPY is now going to rise back up towards 109.20 price level to complete bullish Wave 5, in coming trading days.


Currently; Wave 4 pattern looks complete and price action offers a possible Buy trade setup to join an up trend. However; if price of USD/JPY currency pair breaks below 100.00 critical support level then I might like to stay out of the market and re-examine the four hours chart of USD/JPY currency pair.
 

Attachments

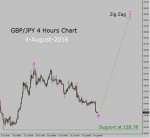
GBP/JPY Bullish Zig Zag in 4 hours chart

Trend is bullish in GBP/JPY currency pair, 4 hour time frame. As I have suggested past week during my daily Live trading room session, market is falling down on a short term basis to complete bearish wave B pull back which is part of a larger version of a Bullish Zig Zag pattern and traders should look for a short trade.

So, all those Forex traders who have followed the analysis have made the right decision as the price has descended. Strong key support level is present at 128.78 price level.

Be sure to check out daily Forex market updates via Live Trading Room. Price action in GBP/JPY is now going to rise back up towards 154.60 price level to complete bullish Zig Zag - Wave c leg, in coming trading days.

Currently; Zig Zag pattern looks in-complete and market action offers a possible Buy trade setup to join an up trend. However; if price of GBP/JPY currency pair breaks below 128.78 critical support level then I might like to stay out of the market and re-examine the four hours chart of GBP/JPY currency pair.
 

Attachments

USD/CAD Sell trade setup in 4 hours chart

Here is an update of USD/CAD currency pair, 4 hours chart.

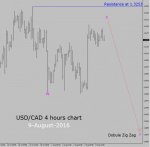
Trend is bearish in USD/CAD currency pair, 4 hour time frame. As I have suggested past week during my daily Live trading room session, market is rising up on a short term basis to complete bullish Wave X leg which is part of a larger version of a Double Zig Zag pattern and traders should look for a long trade. So, all those Forex traders who have followed the analysis have made the right decision as the price has ascended. Strong key resistance level is present at 1.3253 price level.

Be sure to check out daily Forex market updates via Live Trading Room. In my judgement, price action in USD/CAD is now going to drop back towards 1.2855 price level to complete bearish Wave Y, in coming trading days.

Currently; Wave X pattern looks complete and price action offers a possible Sell trade setup to join the down trend. However; if price of USD/CAD currency pair breaks above 1.3253 critical resistance level then I might like to stay out of the market and re-examine the four hours chart of USD/CAD currency pair.
 

Attachments

Up trend in GBP/USD 4 hours chart - Bullish Zig Zag

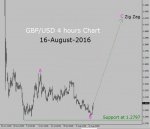
Trend is bullish in GBP/USD currency pair, 4 hour time frame. As I have suggested past week during my daily Live trading room session, market is rising up on a short term basis to complete bullish Wave C leg which is part of a larger version of a bullish Zig Zag pattern and traders should look for a long trade. So, all those Forex traders who have followed the analysis have made the right decision as the price has ascended. Strong key support level is present at 1.2797 price level.

Be sure to check out daily Forex market updates via Live Trading Room. In my judgement, price action in GBP/USD is now going to rise up more towards 1.4270 price level to complete bullish Wave C leg, in coming trading days.

Currently; bullish Zig Zag pattern looks in-complete and price action offers a possible Buy trade setup to join an up trend. However; if price of GBP/USD currency pair breaks below 1.2797 critical support level then I might like to stay out of the market and re-examine the four hours chart of GBP/USD currency pair.

See the attached screen shot image of GBP/USD 4 hours chart
 

Attachments

EUR/USD - Sell setup in 15 minutes chart

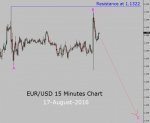
Trend is bearish EUR/USD currency pair, 15 minutes time frame. As I have suggested yesterday, during my daily Live trading room session, market is rising up on a short term basis to complete bullish Wave B leg which is part of a larger version of a bearish Zig Zag pattern and traders should look for a long trade. So, all those Forex traders who have followed the analysis have made the right decision as the price has ascended. Strong key resistance level is present at 1.1322 price level.

Be sure to check out daily Forex market updates via Live Trading Room. In my judgement, price action in EUR/USD is now going to drop towards 1.1175 price level to complete bearish Wave C leg, in coming trading days.

Currently; bearish Zig Zag pattern looks in-complete and price action offers a possible Sell trade setup to join the down trend. However; if price of EUR/USD currency pair breaks above 1.1322 critical resistance level then I might like to stay out of the market and re-examine the Fifteen minutes chart of EUR/USD currency pair.

See the attached screen shot image of EUR/USD 15 Minutes chart.
 

Attachments

Up trend in USD/CHF 30 Minutes chart

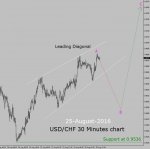
Trend is bullish in USD/CHF currency pair, 30 minutes time frame. As I have suggested yesterday during my daily Live trading room session, market is rising up on a short term basis to complete bullish Wave A leg which is part of a larger version of a bullish Zig Zag pattern and traders should look for a long trade. So, all those Forex traders who have followed the analysis have made the right decision as the price has ascended. Strong key support level is present at 0.9536 price level.

Be sure to check out daily Forex market updates via Live Trading Room. In my judgement, price action in USD/CHF is now going to drop first before it goes back up towards 0.9765 price level to complete bullish Wave C leg, in coming trading days.

Currently; I expect price to start the drop which is just going to be a short term pull back. Bearish pull back in price action offers a possible Buy trade setup to join an up trend. However; if price of USD/CHF currency pair breaks below 0.9536 critical support level then I might like to stay out of the market and re-examine the thirty minutes chart of USD/CHF currency pair.

See the attached screen shot image of USD/CHF 30 minutes chart.
 

Attachments

Sell setup in EUR/USD 4 hours chart

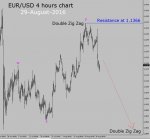
Trend is bearish in EUR/USD currency pair, 4 hour time frame. As I have suggested past week during my daily Live trading room session, market is rising up on a short term basis to complete bullish Wave Y leg which is part of a larger version of a Double Zig Zag pattern and traders should look for a long trade. So, all those Forex traders who have followed the analysis have made the right decision as the price has ascended. Strong key resistance level is present at 1.1366 price level.

Be sure to check out daily Forex market updates via Live Trading Room. In my judgement, price action in EUR/USD is now going to drop towards 1.0700 price level to print a bearish Double Zig Zag pattern, in coming trading days.

Currently; bearish Double Zig Zag pattern looks in-complete and price action offers a possible Sell trade setup to join the down trend. However; if price of EUR/USD currency pair breaks above 1.1366 critical resistance level then I might like to stay out of the market and re-examine the four hour chart of EUR/USD currency pair.

See the attached screen shot image of EUR/USD 4 hours chart.
 

Attachments

EUR/JPY - Down Trend in 4 hours chart

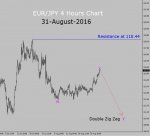
Trend is bearish in four hours chart. Critical resistance is present at 118.44 price level. The price of EUR/JPY currency pair has moved up and it looks like we are getting a bearish Double Zig Zag Corrective Elliott wave pattern.

As the trend is still down so, it is a good idea to look for a sell trade and join the down trend. However; if market close a bullish candlestick above 118.44 resistance area then bearish trend will end. In such case, I will stop myself from trading and re-analyze the price chart of EUR/JPY currency pair.

See the attached screen shot image of EUR/JPY 4 hours chart.
 

Attachments

Live Forex Chart

Currency
Rates
EUR / USD
1.15391
USD / JPY
155.135
GBP / USD
1.34706
USD / CHF
0.81926
USD / CAD
1.39291
EUR / JPY
179.012
AUD / USD
0.71309
Back
Top
Log in Register