TifiaFX
Fun Poster
- Messages
- 693
- Joined
- Mar 14, 2017
- Messages
- 693
- Reaction score
- 0
- Points
- 20
Brent: short positions are preferred
11/15/2019
A report released on Thursday by the US Department of Energy indicated another increase in US oil reserves (+2.219 million barrels, with a forecast of +1.649 million barrels). US oil inventories rose to 449 million barrels and are still 3% above the 5-year average for this time of year. The EIA also reported an unexpected increase in gasoline inventories by 1.9 million barrels and an increase in US oil production by 200,000 barrels per day, to a new record high of 12.8 million barrels per day.
The report indicates that US oil reserves continue to grow. This is the eighth consecutive week of oil reserves growth.
Despite the negative data for oil quotes, the optimism of the oil market participants, which was associated with expectations of a trade agreement between the US and China, contributed to an increase in oil prices in the last 2 months.
As announced earlier this month, the Ministry of Commerce of China, the parties agreed to abolish duties at the same time and in equal amounts if a trade agreement of the first phase is signed.
Oil demand also grew thanks to growth in the global and US stock markets.
All three major US stock indexes hit record highs thanks to a robust US labor market, hopes for a US-China trade dispute and a successful corporate reporting season.
Nevertheless, trade disagreements between the US and China continue despite oral agreements that gave hope for a delay in the introduction of new duties, while US oil reserves are growing with rising production levels.
These are negative factors for oil quotes.
Baker Hughes report on the number of active drilling rigs in the USA, which will be presented at 18:00 (GMT), will be in the focus of attention of oil market participants on Friday. It will probably indicate a further slowdown in drilling operations in the United States, as the relatively low oil prices force some shale oil producers to temporarily slow down.
Previous reports indicated a decrease in the number of active oil platforms in the United States. If the report again indicates a decrease in the number of such installations, then this may give a short-term positive impetus to prices.
Nevertheless, it is still premature to talk about a change in the bearish trend of oil to bullish.
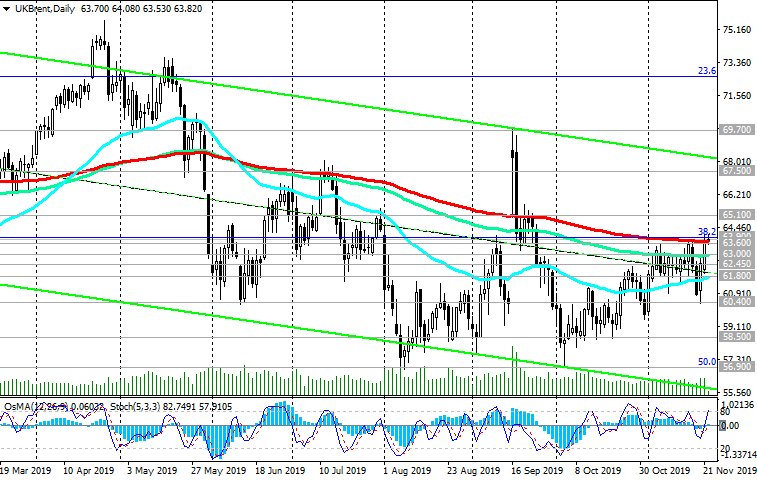
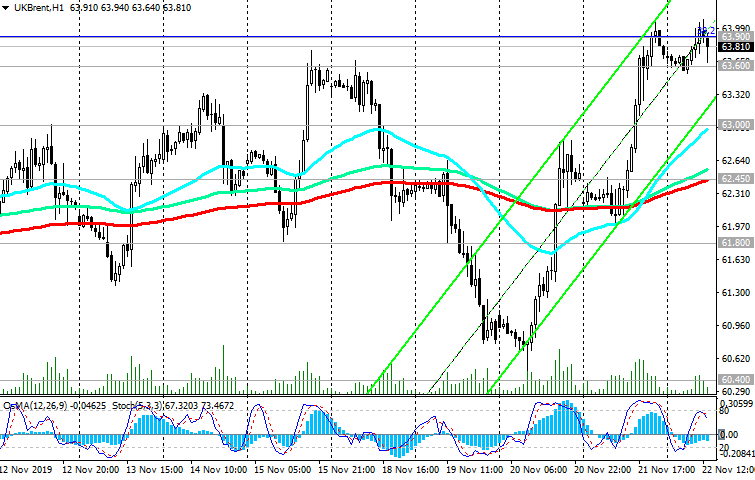
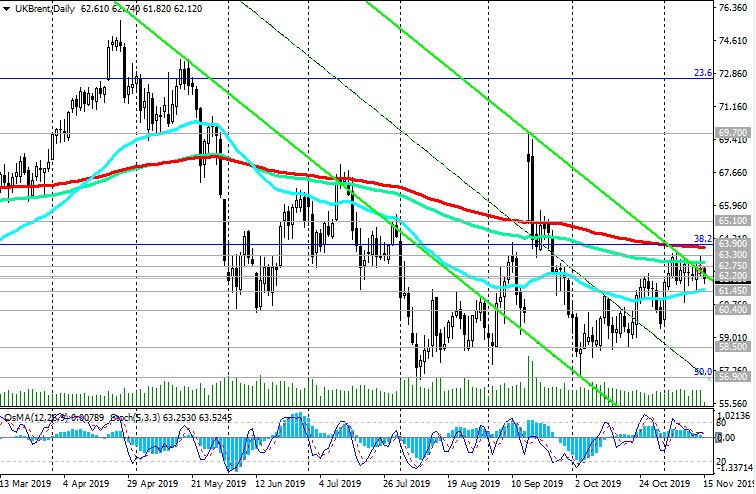
The price could not develop an upward trend above 63.30. Above it, there is a key resistance level of 63.90 (EMA200 on the daily chart and a Fibonacci level 38.2% of the downward correction in the wave of price growth from a level near the level of 27.10 to the highs of October 2018 near the level of 86.60 dollars per barrel).
And while the price is trading in the zone below this resistance level, short positions look preferable, which speaks in favor of resuming sales when local correction levels of resistance will be reached.
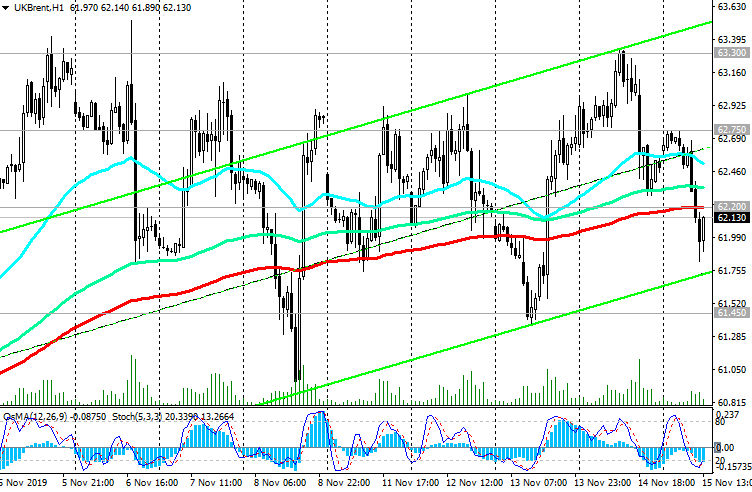
The breakdown of the support level of 61.45 (EMA200 on the 4-hour chart, EMA50 on the daily chart) will mean the resumption of the global downtrend with support at 60.40 (May lows), 58.50, 56.90 (Fibonacci level of 50% and the middle of the downward channel on the daily chart).
Support Levels: 61.45, 60.40, 58.50, 56.90
Resistance Levels: 62.20, 62.75, 63.30, 63.90
Trading Recommendations
Sell by market, Sell Limit 62.75, 63.30, 63.90. Stop-Loss 64.10. Take-Profit 61.45, 60.40, 58.50, 56.90
Buy Stop 64.10. Stop-Loss 62.90. Take-Profit 65.10, 67.00, 68.00, 69.00
*) For up-to-date and detailed analytics and news on the forex market visit Tifia Forex Broker website tifia.com
11/15/2019
A report released on Thursday by the US Department of Energy indicated another increase in US oil reserves (+2.219 million barrels, with a forecast of +1.649 million barrels). US oil inventories rose to 449 million barrels and are still 3% above the 5-year average for this time of year. The EIA also reported an unexpected increase in gasoline inventories by 1.9 million barrels and an increase in US oil production by 200,000 barrels per day, to a new record high of 12.8 million barrels per day.
The report indicates that US oil reserves continue to grow. This is the eighth consecutive week of oil reserves growth.
Despite the negative data for oil quotes, the optimism of the oil market participants, which was associated with expectations of a trade agreement between the US and China, contributed to an increase in oil prices in the last 2 months.
As announced earlier this month, the Ministry of Commerce of China, the parties agreed to abolish duties at the same time and in equal amounts if a trade agreement of the first phase is signed.
Oil demand also grew thanks to growth in the global and US stock markets.
All three major US stock indexes hit record highs thanks to a robust US labor market, hopes for a US-China trade dispute and a successful corporate reporting season.
Nevertheless, trade disagreements between the US and China continue despite oral agreements that gave hope for a delay in the introduction of new duties, while US oil reserves are growing with rising production levels.
These are negative factors for oil quotes.
Baker Hughes report on the number of active drilling rigs in the USA, which will be presented at 18:00 (GMT), will be in the focus of attention of oil market participants on Friday. It will probably indicate a further slowdown in drilling operations in the United States, as the relatively low oil prices force some shale oil producers to temporarily slow down.
Previous reports indicated a decrease in the number of active oil platforms in the United States. If the report again indicates a decrease in the number of such installations, then this may give a short-term positive impetus to prices.
Nevertheless, it is still premature to talk about a change in the bearish trend of oil to bullish.
The price could not develop an upward trend above 63.30. Above it, there is a key resistance level of 63.90 (EMA200 on the daily chart and a Fibonacci level 38.2% of the downward correction in the wave of price growth from a level near the level of 27.10 to the highs of October 2018 near the level of 86.60 dollars per barrel).
And while the price is trading in the zone below this resistance level, short positions look preferable, which speaks in favor of resuming sales when local correction levels of resistance will be reached.
The breakdown of the support level of 61.45 (EMA200 on the 4-hour chart, EMA50 on the daily chart) will mean the resumption of the global downtrend with support at 60.40 (May lows), 58.50, 56.90 (Fibonacci level of 50% and the middle of the downward channel on the daily chart).
Support Levels: 61.45, 60.40, 58.50, 56.90
Resistance Levels: 62.20, 62.75, 63.30, 63.90
Trading Recommendations
Sell by market, Sell Limit 62.75, 63.30, 63.90. Stop-Loss 64.10. Take-Profit 61.45, 60.40, 58.50, 56.90
Buy Stop 64.10. Stop-Loss 62.90. Take-Profit 65.10, 67.00, 68.00, 69.00
*) For up-to-date and detailed analytics and news on the forex market visit Tifia Forex Broker website tifia.com