TifiaFX
Fun Poster
- Messages
- 693
- Joined
- Mar 14, 2017
- Messages
- 693
- Reaction score
- 0
- Points
- 20
WTI: negative dynamics prevail despite corrective growth
10/18/2019
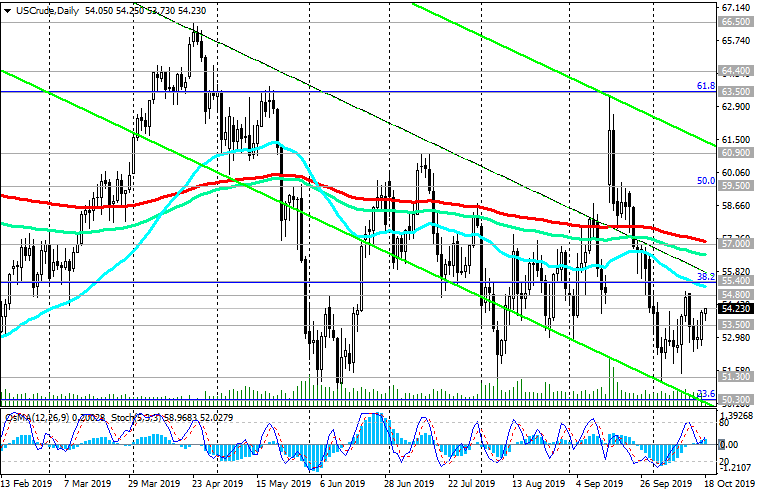
In the middle of last month, the price of WTI crude oil rose sharply, approaching a strong resistance level of 63.50 (Fibonacci level 61.8% of the upward correction to the fall from the highs of the last few years near 76.80 to the support level near 42.15, as well as the upper border of the downward channel on the daily chart). The sharp rise in oil prices was facilitated by terrorist attacks on oil refineries in Saudi Arabia.
However, the price failed to break through this resistance level and subsequently fell, returning to the zone below the key level of 57.00 (ЕМА144, ЕМА200 on the daily and weekly charts).
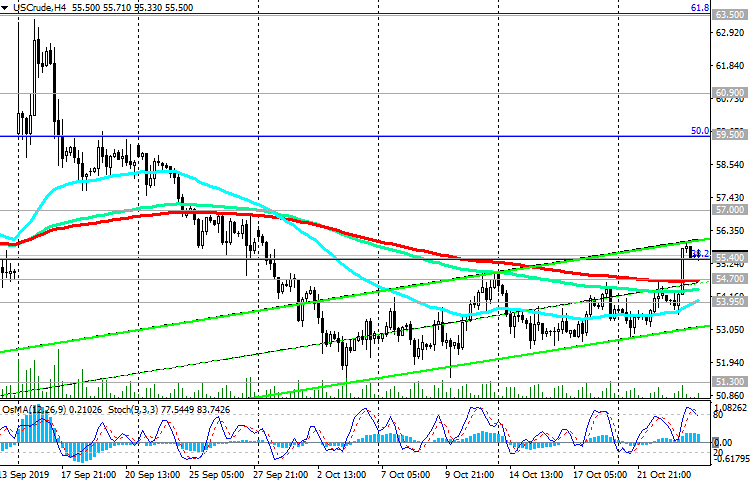
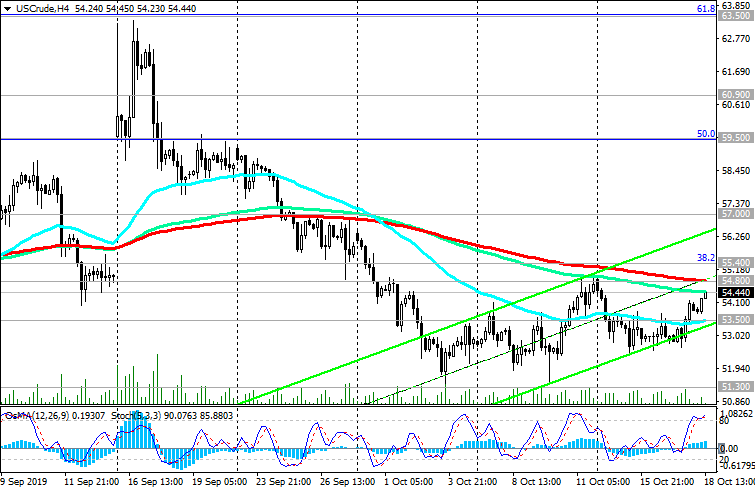
At the beginning of the European session, WTI crude oil is trading near 54.20, below the resistance level of 54.80 (EMA200 on the 4-hour chart).
The breakdown of the short-term support level of 53.50 (ЕМА200 on the 1-hour chart) will resume the bearish trend.
In an alternative scenario, the signal to resume purchases will be a breakdown of the resistance level of 55.40 (EMA50 on the daily chart and the Fibonacci level of 38.2%).
Further growth and the breakdown of the resistance level of 57.00 will strengthen the bullish momentum and direct the price to the resistance level of 60.90 (July highs) and to the 63.50, 64.40 marks.
So far, a negative impulse prevails. Below the resistance level of 54.80, only short positions should be considered.
Now, oil market participants will follow the publication on Friday (at 17:00 GMT) of the weekly report of the American oilfield services company Baker Hughes on the number of active drilling rigs in the United States. Previous reports indicated a decrease in the number of active oil platforms in the United States, to 712 units at the moment. If the report again indicates a decrease in the number of such installations, then this may give a short-term positive impetus to prices.
However, so far, a negative impulse prevails, contributing to a further decline in oil prices.
The situation in the global stock and commodity markets may deteriorate again if on Saturday the British Parliament does not approve the Brexit.
In this case, world stock indices may fall again, pulling down oil quotes.
Support Levels: 53.50, 52.00, 51.30, 50.30, 49.00, 42.15
Resistance Levels: 54.80, 55.40, 57.00, 59.50, 60.90, 63.50, 64.40, 66.50
Trading recommendations
Sell Stop 53.40. Stop-Loss 55.50. Take-Profit 53.00, 52.00, 51.30, 50.30, 49.00, 42.15
Buy Stop 55.50. Stop-Loss 53.40. Take-Profit 57.00, 59.50, 60.90
*) For up-to-date and detailed analytics and news on the forex market visit Tifia Forex Broker website tifia.com
10/18/2019
In the middle of last month, the price of WTI crude oil rose sharply, approaching a strong resistance level of 63.50 (Fibonacci level 61.8% of the upward correction to the fall from the highs of the last few years near 76.80 to the support level near 42.15, as well as the upper border of the downward channel on the daily chart). The sharp rise in oil prices was facilitated by terrorist attacks on oil refineries in Saudi Arabia.
However, the price failed to break through this resistance level and subsequently fell, returning to the zone below the key level of 57.00 (ЕМА144, ЕМА200 on the daily and weekly charts).
At the beginning of the European session, WTI crude oil is trading near 54.20, below the resistance level of 54.80 (EMA200 on the 4-hour chart).
The breakdown of the short-term support level of 53.50 (ЕМА200 on the 1-hour chart) will resume the bearish trend.
In an alternative scenario, the signal to resume purchases will be a breakdown of the resistance level of 55.40 (EMA50 on the daily chart and the Fibonacci level of 38.2%).
Further growth and the breakdown of the resistance level of 57.00 will strengthen the bullish momentum and direct the price to the resistance level of 60.90 (July highs) and to the 63.50, 64.40 marks.
So far, a negative impulse prevails. Below the resistance level of 54.80, only short positions should be considered.
Now, oil market participants will follow the publication on Friday (at 17:00 GMT) of the weekly report of the American oilfield services company Baker Hughes on the number of active drilling rigs in the United States. Previous reports indicated a decrease in the number of active oil platforms in the United States, to 712 units at the moment. If the report again indicates a decrease in the number of such installations, then this may give a short-term positive impetus to prices.
However, so far, a negative impulse prevails, contributing to a further decline in oil prices.
The situation in the global stock and commodity markets may deteriorate again if on Saturday the British Parliament does not approve the Brexit.
In this case, world stock indices may fall again, pulling down oil quotes.
Support Levels: 53.50, 52.00, 51.30, 50.30, 49.00, 42.15
Resistance Levels: 54.80, 55.40, 57.00, 59.50, 60.90, 63.50, 64.40, 66.50
Trading recommendations
Sell Stop 53.40. Stop-Loss 55.50. Take-Profit 53.00, 52.00, 51.30, 50.30, 49.00, 42.15
Buy Stop 55.50. Stop-Loss 53.40. Take-Profit 57.00, 59.50, 60.90
*) For up-to-date and detailed analytics and news on the forex market visit Tifia Forex Broker website tifia.com