ea shop
Freshie
- Messages
- 39
- Joined
- Feb 8, 2012
- Messages
- 39
- Reaction score
- 0
- Points
- 6
The Best Forex Patterns
Technical analysis of GBPUSD
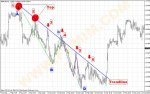
The following example is a typical example which shows the power of technical analysis and concentration of the Forextraders to the principles of technical analysis. This educational example reminds the traders that the market should be analyzed for a long time no just a short period of time.The below chart is the chart of GBP/USD in 1h time frame from 8th of February to 16th of February. On 8th February to 9th February, two important price peaks were formed which are indicated by red circles in the below picture. By linking these two points, which are the price ceilings, a descending trend line will form which we can use it for technical analysis and forecasting the future of the market (Points 1, 2). In this example, the descending trend line works very well and it prevents forming of an ascending trend for 4 times.
Analyzing of points 3, 4, 5, 6
Point 3
The first encounter of the price with the descending trend line happens in this point. Please consider how the price moves toward the descending line with the ascending candles strongly. But as soon as reaching of the price to this line, the price will stop moving and this is a sign of buyers’ retreat and their loss.
Point 4
After the falling of the price in point 3, the buyers are more conservative about the market. Therefore, The price with a harmonic movement of AB=CD which indicates a reformation in the price moves toward the descending trend line. Formation of several candles on the trend line indicates that there is war between the buyers and sellers but this war is not the sign of decisiveness of the sellers. Finally, the price fell and by considering the pattern of AB=CD the trader believed that the possibility of the success of point 4 is more than the other points.
Point 5
The price peak of point 5 is more than 50% in Fibonacci ratios (from the begriming of falling of the price is point 4 to the end of it) which along with the descending trend line causes the falling of the price for the second time.
Point 6
In analyzing the point 6, traders find a harmonic pattern of AB=CD. This pattern is a sign of falling of the price from this point.
End of the descending trend line
The warning of trend line’s losing power is issued by the formation of the harmonic and strong pattern of AB=CD which are indicated by the green lines. As you can see after the falling of the price in point 6 the ascending trend of the price is started. The important point which proves the accuracy of the performance of the AB=CD pattern, indicated by green line, is accompanying pattern like the AB=CD pattern itself. This same pattern make the AB=Cd pattern a stronger comparing the normal pattern.
Written by the technical team of FXMIM
www.fxmim.com
Technical analysis of GBPUSD
The following example is a typical example which shows the power of technical analysis and concentration of the Forextraders to the principles of technical analysis. This educational example reminds the traders that the market should be analyzed for a long time no just a short period of time.The below chart is the chart of GBP/USD in 1h time frame from 8th of February to 16th of February. On 8th February to 9th February, two important price peaks were formed which are indicated by red circles in the below picture. By linking these two points, which are the price ceilings, a descending trend line will form which we can use it for technical analysis and forecasting the future of the market (Points 1, 2). In this example, the descending trend line works very well and it prevents forming of an ascending trend for 4 times.
Analyzing of points 3, 4, 5, 6
Point 3
The first encounter of the price with the descending trend line happens in this point. Please consider how the price moves toward the descending line with the ascending candles strongly. But as soon as reaching of the price to this line, the price will stop moving and this is a sign of buyers’ retreat and their loss.
Point 4
After the falling of the price in point 3, the buyers are more conservative about the market. Therefore, The price with a harmonic movement of AB=CD which indicates a reformation in the price moves toward the descending trend line. Formation of several candles on the trend line indicates that there is war between the buyers and sellers but this war is not the sign of decisiveness of the sellers. Finally, the price fell and by considering the pattern of AB=CD the trader believed that the possibility of the success of point 4 is more than the other points.
Point 5
The price peak of point 5 is more than 50% in Fibonacci ratios (from the begriming of falling of the price is point 4 to the end of it) which along with the descending trend line causes the falling of the price for the second time.
Point 6
In analyzing the point 6, traders find a harmonic pattern of AB=CD. This pattern is a sign of falling of the price from this point.
End of the descending trend line
The warning of trend line’s losing power is issued by the formation of the harmonic and strong pattern of AB=CD which are indicated by the green lines. As you can see after the falling of the price in point 6 the ascending trend of the price is started. The important point which proves the accuracy of the performance of the AB=CD pattern, indicated by green line, is accompanying pattern like the AB=CD pattern itself. This same pattern make the AB=Cd pattern a stronger comparing the normal pattern.
Written by the technical team of FXMIM
www.fxmim.com
Attachments
-
 212.9 KB Views: 116