BTC USD 82,934.2 Gold USD 4,194.30
Time now: Jun 1, 12:00 AM

RoboForex - roboforex.com

Dear traders!

This week, the ContestFx project is waiting for you in the following competitions:

The 118th competition of "Demo Forex" has accelerated to "full speed".
The 293rd competition of "Week with CFD" just started today.
The 426th competition of "Trade Day" will start on 20.01.2021 at 12:00.
The 342nd competition of "KingSize MT5" will start on 21.01.2021 at 20:00.

If you want to earn money on the Forex market without investing your own funds required as an initial deposit, you need to be among the winners of our demo competitions, and the prize money you receive as a reward to your trading account will help you to do it.

Do not miss your chance!

Sincerely,
RoboForex Contest
 
How to Trade by Puria Method Strategy?

Author: Victor Gryazin

roboforex-header.jpg


Dear Clients and Partners,​

In this overview, we will discuss an indicator strategy known as the Puria method. Regardless of such a mysterious name, this is quite a simple and understandable strategy based on signals from four standard indicators.

What is the Puria strategy based on?

Puria is an intraday indicator strategy aimed at buying/selling currency pairs during a trading day. In other words, it is meant for making small but regular profits. Each trade opened by the trading strategy is aimed at earning 15-25 points.

The trades are first and foremost based on finding a crossing of three Moving Averages. Two slow Weighted MAs (red ones) with periods 75 and 85 are sometimes crossed by a yellow signal EMA with period 5. Trades are opened in the direction of the crossing, an additional filter for signal confirmation being the MACD (15, 26, 1).

This strategy does not imply using tech analysis, it is based solely on signals from indicators. You can use any currency pairs and their cross rates; what will depend on your instrument is just the size of your profit. Timeframes recommended for trading are M30 and H1, though some traders try M15 as well. Anyway, this is a good strategy for indicator intraday trading.

Signal to buy
  • The price chart rises above the slow MAs.
  • The fast yellow EMA (5) crosses its red counterparts from below.
  • The MACD histogram crosses the central line from below. At least one bar of the histogram must close above zero.
  • Open a buying position with the SL and TP set according to the recommendations above.
puria-buy-1001x630.png


Closing thoughts

The Puria Method Strategy is an easy way to trade intraday using signals from four indicators. However, keep in mind that no matter how profitable the strategy promises to be, market conditions are prone to change, so a positive result is never guaranteed. Before trading for real, test the Puria strategy on a demo account and make sure it is efficient for the current market conditions.

Read more at R Blog - RoboForex

Sincerely,
RoboForex team
 
How to calculate Return on Equity (ROE)?

Author: Victor Gryazin

roboforex-header.jpg


Dear Clients and Partners,​

In this article, we’ll talk about the Return on Equity (ROE), one of the key indicators of investment returns, which helps to assess the financial stability and investment attractiveness of different companies.

What is the ROE for?

roe1.jpg


The Return on Equity is an indicator that assesses how effective the funds invested by companies’ shareholders are. As a matter of fact, the ROE is the company’s annual profit after taxes, fees, and other statutory expenses, divided by the cost of all funds invested by its founders and shareholders without borrowed money.

As a rule, investors prefer companies and firms with a higher ROE. However, profits and incomes in different sectors of the economy vary a lot. For example, the indicator may differ even within the same sector if a company decides to pay dividends instead of keeping profits as available cash assets.

It’s important to assess the ROE in real-time mode, for a particular period of time (for example, 5 years). Investors usually calculate the ROE at the beginning and the end of their investment period, so that they could see real changes in profitability. This method gives the opportunity to assess the growth dynamics and compare the results with other companies’ performance.

A stable and eventually growing ROE attract investors. The ROE growth means that the chosen company is reliable and can produce stable income because it knows how to wisely employ its capital in order to increase performance and profits. On the other hand, the ROE decline may indicate that the company’s management makes wrong decisions and invests money in non-profitable assets.

Example of the ROE calculation

roe2.jpg


For example, the company’s net income at year-end is $100,000$. At the same time, the average shareholders’ equity consists of 50,000 shares worth $5 each. In this case, the ROE will be calculated as follows:

ROE = 100,000 / 50,000 * 5 * 100% = 40%

It’s a high ROE, which says that the company is actively developing. For a more detailed estimate, it will be better to analyze the average ROE dynamics over 3-5 years – it will provide a fair insight into the company’s prospects.

However, one should remember that even if the OE is growing, the company’s profit is not necessarily paid to investors. If the company decides to keep its profits without paying dividends, shareholders may get profit only indirectly, due to the rise of the company’s share price.

Read more at R Blog - RoboForex

Sincerely,
RoboForex team
 
Dear traders!

This week, the ContestFx project will continue with the following competitions:

The 118th competition of "Demo Forex" has entered the final phase.
The 294th competition of "Week with CFD" has just kicked off.
The 427th competition of "Trade Day" will start on 27.01.2021 at 12:00.
The 343rd competition of "KingSize MT5" will start on 28.01.2021 at 20:00.

Let us remind you that participation in any desired competition becomes available for you after you go through a simple registration procedure, while the prize money will allow the winners to start trading on the Forex market without investing their own financial resources.

Good luck!

Sincerely,
RoboForex Contest
 
How to Use Moving Average for Buying Stocks?

Author: Maks Artemov

roboforex-header.jpg


Dear Clients and Partners,
​

The Moving Average has long been on the trading scene and has become an intrinsic part of many trading strategies. Though simple, the indicator works on almost all timeframes and with any instrument.

There are plenty of indicators based on the MA, being, in essence, the same old MA slightly alternated. This is a trend indicator, and its main task is to indicate the direction of the price, smoothing out noises and insignificant fluctuations.

Setting up the indicator

The Moving Average has several settings:

  • Period is the number of bars used for calculations. It can be 1 and higher.
  • Shift is the number of bars by which the period will be shifted.
  • Method: there are the Simple (SMA), Exponential (EMA), and Weighted (WMA) Moving Averages.
  • Apply to: close, open, high, or low.
Alternating these parameters, a trader can set up the indicator for a certain instrument and trading conditions. There are plenty of ways to use the indicator. MAs with large periods are normally used for medium-term trading. Trading intraday rather requires using MAs with periods below 100.

What it looks like on the chart

First of all, set the parameters. The smaller the period, the closer the MA will follow the price chart, mimicking the price. In the picture, we see EMA5, which means that the calculation period is 5 last bars, the shift is zero, apply to close.

ema-5-1-1200x522.png


If we choose period 100, the MA will follow the chart closely and sometimes cross it.

ema-100-2-1200x521.png


If we use a period above 100, the MA chart will move farther away from the price chart and close it rarer.

ema-200-3-1200x523.png


Using the MA for trading stocks

Based on the fact that the charts of stocks do not differ much from those of currency pairs or cryptocurrencies, you can use the indicator without significant limitations. Market players say that “bears live under the MA200 and the bulls – above it”. This means that, in the long run, the indicator speaks about the continuation of the current trend.

Read more at R Blog - RoboForex

Sincerely,
RoboForex team
 
How to Trade Arthur A. Merrill’s M and W Patterns

Author: Andrey Goilov

roboforex-header.jpg


Dear Clients and Partners,​

Arthur Merrill, the hero of this article, called his patterns “wave structures”. The name is connected to the popularity of Dow Theory, describing wave-like price movements, at those times. By the way, popular Elliott’s Waves are based on this theory.

Merrill tried to find the same logic in graphic structures because many sooner or later turn back to searching patterns on the chart. In the end, he singled out 32 graphic patterns and distributed them between two groups: 16 M-shaped and 16 W-shaped patterns. They indicate the end of either an ascending or descending trend, sort of reflecting one another mirror-like.

The history of Merrill’s patterns

The first attempt to describe such patterns is considered to belong to Robert Levi, a financier. In 1971, he took up studying five-pointed price patterns, trying to structure them but failed to complete his studies because the patterns were too abundant (about 2,000 patterns).

Levi abandoned the idea, and it was left behind for a decade. At the beginning of 1980, Arthur Merrill re-took studying the patterns, which resulted in singling out and structuring the five-pointed patterns below.

M1 and W16

The last point of the M1 pattern reflects the end of a decline, but the author says that it is not as much a reversal point, rather a point of being extremely overbought. As for classic tech analysis, this one is similar to the Wedge reversal pattern.

merrills-technical-figures-arthur-a.-merrill-m1-w16.jpg


Here, we also watch the pattern contract and the trend – reverse upon breaking the pattern away. To place the goal, calculate the height of the pattern and measure these points from the point of the breakaway.

M2 and W15

In the M2 pattern, the price goes in some sort of a downward zigzag, after which an upwards zigzag appears, but we do not wait for a renewal of the high as in M1. This pattern is similar to an Inverted Head and Shoulders from classic tech analysis. In the picture, the right “shoulder” is rather low but it still remains an example of our pattern. To estimate the goal, measure the pattern and place the goal as many points away from the breakaway point on the “neck”.

merrills-technical-figures-arthur-a.-merrill-m2-w15.jpg


Also, in a downward movement, when the price fails to demonstrate a new low under the previous one but shows a new high above the previous one, the trend reverses. This is the market’s nature. So even if your understanding of the pattern is simplistic, always keep in mind the potential of a trend reversal when the price cannot go on down and breaks through the nearest high.

Read more at R Blog - RoboForex

Sincerely,
RoboForex team
 
Dear traders!

In the first week of February, RoboForex's project called ContestFX offers you the following competitions:

The 119th competition of "Demo Forex" and 295th competition of "Week with CFD" have just kicked off.
428th competition of "Trade Day" will start on 03.02.2021 at 12:00.
344th competition of "KingSize MT5" will start on 04.02.2021 at 20:00.

If you've never taken part in our exciting competitions, it's easy to do it: you just need to go through a simple registration procedure. After that, participation in any of your desired competitions will be available in just a couple of mouse clicks.

Join us, it won't be boring!

Sincerely,
RoboForex Contest
 
How to Invest in Dow Jones?

Author: Victor Gryazin

roboforex-header.jpg


Dear Clients and Partners,​

The Dow Jones Industrial Average is one of the oldest and most famous stock indices over the globe. It is included in the top-three US indices and boasts the best capitalization among them. In this overview, I will demonstrate to you the structure of Dow Jones and give some advice on investing in it.

History of Dow Jones

The DJIA was created in 1896 by a journalist, editor of the famous Wall Street Journal Charles Henry Dow alongside his business partner Edward Davis Jones. Charles Dow used the average for tracking the stock dynamics of US leading companies with high revenue. Initially, the index consisted mostly of industrial companies producing and selling oil, gas, sugar, tobacco, cotton, etc.

The index has changed several times. In 1916, the list of companies was extended to 20, in 1928 – to 30, and this is the number of companies it includes now. During the Great Depression of the 1930s, the list has been reshuffled because many companies went bankrupt. In 1932, 8 members of the index were replaced by such companies as Coca Cola, the Procter&Gamble Company, etc.

The calculation formula of the index was also updated. When the DJIA was created, it showed just the arithmetical mean of those 12 stocks it contained. Today, we use the Dow correction factor that accounts for structural changes in the companies.

Ways to invest in Dow Jones

The DJIA is a popular high-liquidity asset for trading and investing. For the latter, you can use various financial instruments depending on your strategy: stocks, options, futures, CFDs, ETFs.

Buying stocks from the index

If an investor decides to collect a portfolio of Dow Jones stocks on their own, they will need to buy at least one stock of each company from the index. This will be costly due to the price of certain stocks from the index. Moreover, you will have to watch the market constantly, re-balancing your investment portfolio. The positive side of this investment option is that you will also have your dividends paid to you.

djia-stock-1200x548.png


Futures and options

Futures and options are standardized stock derivatives for the DJIA. Buying them can be interpreted as a trade with a whole portfolio of stocks from the index. Note that you do not get your stocks for real, only contracts for them.

Derivatives let experienced investors use complex strategies with different combinations of futures and options. As a rule, these instruments are used for rather short-term investments – six to twelve months. Long-term investments require changing contracts that are expiring for new ones, which might deteriorate your overall result.

djia-futures-994x630.jpg


Closing thoughts

The DJIA includes the stocks of the US 30 leading companies. It does not only identify the economic situation in the country but is also a popular investment instrument. Thanks to various financial instruments (stocks, futures, ETFs, options), you can use various strategies with the DJIA. The choice is yours, just never forget about risks.

Read more at R Blog - RoboForex

Sincerely,
RoboForex team
 
What is P/E, and How to Use It for Assessing Stocks?

Author: Victor Gryazin

roboforex-header.jpg


Dear Clients and Partners,​

Before choosing stocks or packages of stocks for investments, investors study the charts and reports of companies but often miss an important coefficient/index – P/E (Price/Earnings). Let us try to find out what is this index and how we can use it.

What is P/E?

P/E is a multiplier used for checking if a company is overpriced or underpriced and shows its primary investment attractiveness for investors. Based on P/E, you can conclude how fast your investments in a company will pay off.

How P/E is calculated?

P (Price) is the company’s capitalization or, in other words, its exchange price. It is calculated by multiplying the price of one stock by the whole number of stocks in circulation.

For example, the X company has 1 million stocks in circulation; the current stock price is 2 USD. This means the company’s capitalization is 2 million USD.

E (Earnings) is the company’s net profit for the reporting period. Normally, for calculations, we use the data for the last calendar year. Also, in certain cases, we use the forecast profit that the company will receive in the future or sliding profit. Note that sometimes this index is overstated to make the company more attractive, but later, it might decline. To put it simply, P/E tells us how long it will take your investments to pay back.

The lower the index, the sooner it will happen.

However, things are not as simple as they seem. A low P/E value means that the company is underpriced, and its stocks will be moving towards a fair price, which will make the earnings of the investor in the long run. On the other hand, low P/E might mean some negative background or serious problems in the company.

A P/E value higher than the market average means that the company is overpriced, so investments in it might not pay back in the medium or long run.

3 ways of calculating P/E:
  • Yearly (normal) is the P/E of the previous calendar year.
  • Sliding P/E is the P/E of the previous four quarters, regardless of the quarter when it is calculated.
  • Forward P/E is forecast P/E. The calculation is made at the beginning of the fourth quarter – for the future.
Example

Yearly P/E: in the new 2021, we calculate P/E based on the profit and stock rice in the previous 2020.

Sliding P/E: at the end of Q1, 2021, we form P/E based on three quarters of 2020 and the first quarter of 2021.

Forward P/E: at the beginning of Q4, 2021, we forecast P/E. The values of Q4, 2020 will be nonobjective due to the change in market conditions. Based on preliminary calculations and forecasts, we calculate the multiplier for the next quarter. The calculation will be conditional, however, it will show some perspectives of the company and make some forecasts.

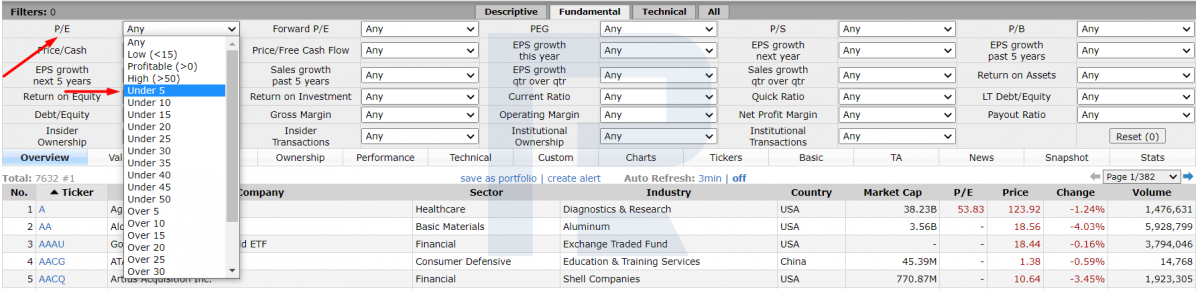
pe-1-1200x289.png


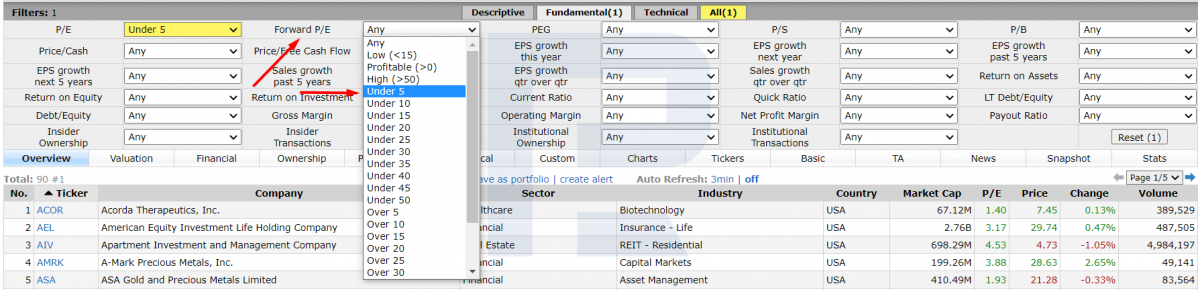
pe-2-1200x290.png


How to use P/E?

To realize the perspectives of investments in a certain company, it is not enough just to know its P/E. You need to compare it with other indices as well.

Read more at R Blog - RoboForex

Sincerely,
RoboForex team
 
Dear traders!

This week, the ContestFX project is looking forward to seeing you in the following competitions:

The 119th competition of "Demo Forex" entered its second week.
The 296th competition of "Week with CFD" has just started.
429th competition of "Trade Day" will start on 10.02.2021 at 12:00.
345th competition of "KingSize MT5" will start on 11.02.2021 at 20:00.

We remind you that you can take part in any of your desired competitions after passing through a simple registration process and you can utilize the prize money received as a reward to kick off full-fledged trading on the Forex market without investing your own financial resources required as an initial deposit.

Good luck to all traders!

Sincerely,
RoboForex Contest
 

Live Forex Chart

Currency
Rates
EUR / USD
1.12030
USD / JPY
158.285
GBP / USD
1.32415
USD / CHF
0.82966
USD / CAD
1.42645
EUR / JPY
177.327
AUD / USD
0.69840
Back
Top
Log in Register