Vlad RF
Active Member
- Messages
- 1,721
- Joined
- Aug 5, 2019
- Messages
- 1,721
- Reaction score
- 0
- Points
- 30
What Should a Trader Know About The Williams Percent Range?
Author: Victor Gryazin

Dear Traders,
The Williams Percent Range indicator was developed by a famous trader Larry Williams in 1973. This indicator is meant for identifying oversold and overbought areas on the market.
Indicator description
The Williams Percent Range (Williams %R) is an oscillator of the price movement speed showing the position of the current price in the range between the low and high of the previous periods.
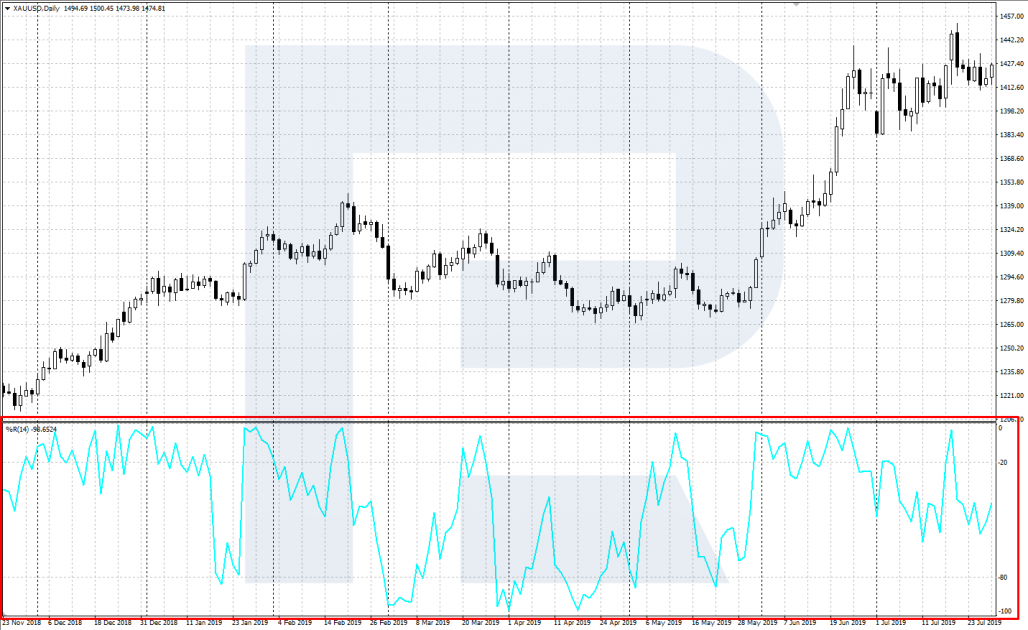
The indicator is drawn in a separate window under the price chart and consists of the main line %R and two areas: the overbought and oversold ones.
The indicator values vary form 0% to -100%; through the levels of -20% and -80% signals lines are drawn, meaning the oversold (from -80% to -100%) and overbought (from 0% to -20%) areas.
The Williams %R compares the closing prices to the set price range and shows whether the buyers can close the price near to the high, or whether the sellers are stronger and will manage to close the price at the low. If the buyers fail to close the price near the highs in an uptrend, this means they are weaker than it seems, and sells become possible.
If the sellers fail to close the price at the lows in a downtrend, this means their strength is fading, and buys might follow.
The formula, characteristics, and settings
The Williams %R is drawn in a separate window under the price chart and consists of the main line %R showing the position of the price in relation to the previous period.
Formula of the main line:
%R = -1 * (Hm C) / (Hm Lm) * 100
Where:
C is the closing price of the previous period
Hm is the high of the last m periods
Lm is the low of the last m periods
When installing the indicator, the following parameters should be set up...
Read more at R Blog
Sincerely,
RoboForex team
Author: Victor Gryazin
Dear Traders,
The Williams Percent Range indicator was developed by a famous trader Larry Williams in 1973. This indicator is meant for identifying oversold and overbought areas on the market.
Indicator description
The Williams Percent Range (Williams %R) is an oscillator of the price movement speed showing the position of the current price in the range between the low and high of the previous periods.
The indicator is drawn in a separate window under the price chart and consists of the main line %R and two areas: the overbought and oversold ones.
The indicator values vary form 0% to -100%; through the levels of -20% and -80% signals lines are drawn, meaning the oversold (from -80% to -100%) and overbought (from 0% to -20%) areas.
The Williams %R compares the closing prices to the set price range and shows whether the buyers can close the price near to the high, or whether the sellers are stronger and will manage to close the price at the low. If the buyers fail to close the price near the highs in an uptrend, this means they are weaker than it seems, and sells become possible.
If the sellers fail to close the price at the lows in a downtrend, this means their strength is fading, and buys might follow.
The formula, characteristics, and settings
The Williams %R is drawn in a separate window under the price chart and consists of the main line %R showing the position of the price in relation to the previous period.
Formula of the main line:
%R = -1 * (Hm C) / (Hm Lm) * 100
Where:
C is the closing price of the previous period
Hm is the high of the last m periods
Lm is the low of the last m periods
When installing the indicator, the following parameters should be set up...
Read more at R Blog
Sincerely,
RoboForex team
Last edited: