BTC USD 82,965.3 Gold USD 4,171.74
Time now: Jun 1, 12:00 AM

RoboForex - roboforex.com

RoboForex: changes in trading schedule (Independence Day in the USA)

roboforex-header.jpg


Dear Clients and Partners,​

We’re informing you that due to the Independence Day in the USA, there will be some changes in the trading schedule*.

MetaTrader 4 / MetaTrader 5 platforms

Trading schedule on Metals (XAUUSD, XAGUSD) and CFDs on Crude Oil (WTI, Brent)
  • July 3rd, 2020 - trading stops at 7:45 PM server time.
  • July 6th, 2020 - trading starts as usual.
Trading schedule on CFDs on US indices (US500Cash, US30Cash, USTechCash)
  • July 3rd, 2020 - trading stops at 7:45 PM server time.
  • July 6th, 2020 - trading starts as usual.
Trading schedule on CFDs on US stocks
  • July 3rd, 2020 - trading stops at 8 PM server time.
  • July 6th, 2020 - trading starts as usual.

R Trader platform

Trading schedule on US stocks and ETFs
  • July 3rd, 2020 - trading stops at 8 PM server time.
  • July 6th, 2020 - trading starts as usual.
Trading schedule on CFDs on US stocks and ETFs
  • July 3rd, 2020 - trading stops at 8 PM server time.
  • July 6th, 2020 - trading starts as usual.
Trading schedule on CFDs on US indices (US500, US30, NAS100)
  • July 3rd, 2020 - trading stops at 8:15 PM server time.
  • July 6th, 2020 - trading starts as usual.
Trading schedule on Metals (XAUUSD, XAGUSD) and CFDs on Crude Oil (BRENT.oil, WTI.oil)
  • July 3rd, 2020 - trading stops at 7:45 PM server time.
  • July 6th, 2020 - trading starts as usual.

cTrader platform

Trading schedule on Metals (XAUUSD, XAGUSD)
  • July 3rd, 2020 - trading stops at 7:45 PM server time.
  • July 6th, 2020 - trading starts as usual.
Please, take into account these changes in schedule when planning your trading activity.

* – This schedule is for informational purposes only and may be changed by the provider.

Sincerely,
RoboForex team
 
Dear traders!

This week RoboForex company project, ContestFx continues with the following competitions :

The 111th competition reached the final stage "Demo Forex".
265th started this morning "Week with CFD".
01.07.2020 starts at 12:00 - 398th "Trade Day".
02.07.2020 starts at 20:00 - 315th "KingSize MT5".

We remind you that all the winners of our demo competitions, as rewards receive prizes into their real trading accounts, they can fully trade in the Forex markets without investing their own financial savings.

Goodluck to all traders!

Sincerely,
RoboForex Contest
 
Last edited:
How to Find Stocks for Short-Term Investments?

Author: Eugene Savitsky

roboforex-header.jpg


Dear Traders,​

There are several ways of investing in the stock market:
  1. You hold stocks for a long time, making a profit on dividends and the growth of the stock price. This is called long-term investing.
  2. You buy stocks and hold them for a short-term investing at making a profit on a future event in the company, such as the publication of quarterly reports. This is short-term investing.
  3. You speculate stocks during a trading session. This is called intraday trading.
I have already explained to you how to find stocks for long-term investments, so today I will speak about short-term investing and how to pick up stocks for this.

The idea of short-term investments

Short-term investments mean waiting for a certain event that is expected in the nearest future. Depending on your idea, you may be holding the stock for any time between a day and several months.

The time of holding an open trade in short-term investments is conditional; in this article, under short-term investments, I will mean holding your position for longer than one trading session and up to several months.

I will say it again that there is no exact border between short- and long-term investing. It depends on how long it will take for the event to happen. Quite often, a short-term investment turns into a long-term one as the investor does not dare to sell the stock upon reaching the goal.

The process of choosing a stock for short-term investing consists of two parts:
  1. Choosing the stock based on tech analysis.
  2. Choosing the stock based on fundamental analysis.
In fact, it is a rare case that a stock is bought based just on one type of analysis. Sometimes the decision is influenced by technical analysis, sometimes by the fundamental one; anyway, if both types of analysis tell you the same, such a choice is perfect.

Choosing stocks for short-term investments by tech analysis

Let us discuss choosing stocks based on tech analysis.

To make the right choice, you must be at least a beginner in tech analysis. The things you need to know are:
  1. The basic graphic patterns.
  2. How to find and use support/resistance levels.
  3. The basic technical indicators and how to work with them.
The easiest way of choosing is by searching for graphic patterns. For this, you will need Finviz.com.

In the stock scanner, choose tech analysis and mark the patterns you are interested in. In our case, we will look for a Triangle chart pattern.

finviz-1200x570.png


Scanning stocks via Finviz.com​

The website uses special software to find the patterns, and the software does not always search correctly, so assess the offered variants yourself, checking at least three pages.

Read more at R Blog - RoboForex

Sincerely,
RoboForex team
 
Diamond: Trading Reversal Pattern

Author: Maks Artemov

roboforex-header.jpg


Dear Traders,​

Today, we will get acquainted with a tech analysis pattern called Diamond. Compared to other tech analysis patterns, the Diamond pattern appears rather rarely on the chart. This is the number one reason for its being unpopular among most traders. On small timeframes, the Diamond takes little time to form and might work off the signal by a couple of candlesticks. On larger timeframes, from D1 and higher, the pattern may take months to complete, which does not enhance its attractiveness for traders.

Not every trader can afford to wait two-three months for the signal to form. However, the Diamond has its advantages: it works off the signal almost always and may bring a substantial profit.

Conditions for and principles of the Diamond formation

The Diamond is a reversal pattern which forms at the top of an uptrend or the bottom of a downtrend. It is easy to guess that it looks like a diamond.

Diamond pattern forming at the top of a trend

Forming at the top of the trend happens as follows. First, the price forms an expanding triangle: it may be isosceles or of a bit irregular shape. After the price reaches the highs, it starts fading, and on the chart, the amplitude of price fluctuations decreases. This is a decrease in the volatility in some sense, when most market players, especially major ones, have taken their positions and start waiting for other players to act.

Then the second wave of players enters the scene: they have noticed the pattern and are eager to make money on the signal. The thing is that the work-off of the Diamond pattern is based on the greed of market latecomers; however, they cannot compete with the first wave of players and just buy at the place where the players of the first wave start selling (closing the positions that have already yielded some profit).

As a result, the quotations start declining quickly, generating certain panic in the market so that the second wave of buyers also hurry to close their positions. Thus, Diamond shape forms at the top of the uptrend.

ris-1-diamond-1200x536.png


Diamond pattern at the top of a trend​

Diamond pattern forming at the bottom of a trend

A similar situation may be seen at the lows of a downtrend, only market participants swap places. For a time, the market is dominated by bears provoking a downtrend. At a certain point, the price begins a sideways movement, expanding the amplitude (creating an expanding triangle), then volatility shrinks, and a second – converging – triangle forms on the chart.

Read more at R Blog - RoboForex

Sincerely,
RoboForex team
 
Dear traders!

This week project ContestFx invites everyone to participate in the following competitions on the demo accounts:

112th competition just started in July "Demo Forex" and 266th "Week with CFD".
08.07.2020 starts at 12:00 - 396th "Trade Day".
09.07.2020 starts at 20:00 - 316th "KingSize MT5".

If you've never been member of our trading battles, we invite you to join them. To take part, only once just go through the simple registration method, after that, you can connect to any competition in just a few mouse clicks.

Join Now!

Sincerely,
RoboForex Contest
 
Using FFcal News Indicator in Trading

Author: Victor Gryazin

roboforex-header.jpg


Dear Traders,​

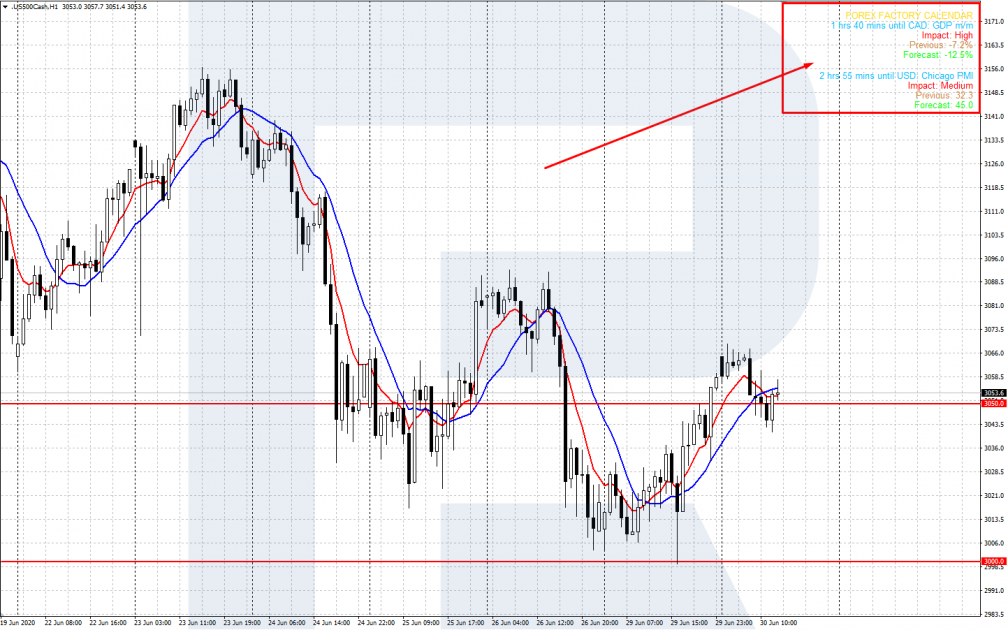
In this review, we will get acquainted with a useful news indicator FFcal. It tracts the publication of important news and reflects them directly on the price chart.

Why is FFcal useful?

The FFcal indicator was created for transferring information from the economic calendar of a well-known news portal Forex Factory to the MetaTrader 4 trading platform. Thanks to FFcal, you can see the publication time of important news, keeping your eyes on the price chart. The settings of the indicator allow filtering news by importance and switching on sound alerts, if necessary.

The publication of important economic (and political) news is a driver for the Forex market. Many traders use the publication of strong news in trading as the mighty impulse of the news may bring a quick profit. The FFcal indicator is a good helper because it will remind you of the upcoming events.

If the trader does not trade news (as such a type of work entails increased risks), knowing when certain data is issued is still vital. Meaningful news may provoke a mighty market movement and change the technical picture completely. Hence, better not enter the market before the publication of influential news and close the existing positions or minimize risks, pulling the Stop Losses closer.

FFcal is displayed in the right upper corner of the price chart of your financial instrument (however, you may change the placement in the settings). Two nearest pieces of news are written in different colors; their importance, the previous and expected levels of the value are specified. The time left until the publication is counted down.

ffcal-1008x630.png


FFCal indicator​

Installing and setting up FFcal

To install FFcal to the popular MetaTrader 4 terminal, download it by the link at the end of this article and copy the file to the Indicators folder. Then, via the Main Menu, open File – Open data catalog – MQL4 – Indicators; copy the file of the indicator and restart the terminal.

Read more at R Blog - RoboForex

Sincerely,
RoboForex team
 
How To Make High Yield Stock Investments?

Author: Eugene Savitsky

roboforex-header.jpg


Dear Traders,​

I have already told you how to find promising stocks in Healthcare sector. In this article, I will tell you about how to choose stocks for high yield investments and give you particular examples of the stocks that may grow in price by dozens of percent in July.

In this article, I will give you particular examples of the stocks that may grow in price by dozens of percent in July.

How to find stocks for high yield investments?

To make a high yield stock investments in a short time, look for stocks with a relatively low price. For example, a stock that costs 50 cents may rise to 1 USD per stock inside one trading session thanks to minor news. As a result, you will make a 100% profit. A stock that costs 100 USD may never show equal profitability in such a short time.

The point here is the low price of the stock which allows investing even with a modest starting capital, while limited trade volumes make the price react to the smallest increase in the demand.

All in all, for high yield stock investments with low risks and a holding the position for a short time, pay attention to cheap stocks which cost less than 5 USD. Let us try to find such stocks.

The first stage of selection

According to the scanner from the Finviz.com website, in the US stock market, there are currently 898 stocks that cost under 5 USD. Hence, you need to know in which sector to look for stocks and which events may push the price upwards.

If you have already read the article mentioned above, you must know that the most promising sector is biotechnologies as this is the sector in which abrupt stock price growth happens most often. The main type of event is the decision of the FDA about some drugs or treatment methods undergoing tests.

So, let us limit ourselves by biotechnologies. Here, Finviz.com selects 176 stocks.

fv-bio-1092x630.png


Finviz scanner - Biotech companies​

Much better, but still too many. Now to the hardest part. Let us scrutinize the list and find the company that will fill our deposit with a good profit.

The second stage of selection

For the second step, let us think logically. If the decisions of the FDA influence the stock price, we need to have a look at the FDA calendar to find out, which drugs will be hearing the verdict in the nearest future.

Read more at R Blog - RoboForex

Sincerely,
RoboForex team
 
Dear traders!

This week, RoboForex's project called ContestFx traditionally continues with the following competitions:

112th competition of "Demo Forex" started last Monday.
267th competition of "Week with CFD" just started recently.
400th competition of "Trade Day" will start on 15.07.2020 at 12:00.
317th competition of "KingSize MT5" will start on 16.07.2020 at 20:00.

Let us remind you that the winners of our demo account contests are presented with prizes, which allow them to start trading on the real Forex market without investing their own funds.

Do not miss your chance!

Sincerely,
RoboForex Contest
 
How to Trade EUR/USD Currency Pair?

Author: Victor Gryazin

roboforex-header.jpg


Dear Traders,​

In this overview, we will discuss trading the EUR/USD currency pair. This is one of the most popular currency pairs in Forex.

History of the EUR/USD pair

eurusd.jpg


The euro (EUR) is quite a young currency, “born” in 1999. The common European currency replaced a whole range of national coins: the Deutsche Mark, the French franc, the Italian lira and many others. Hence, one of the peculiarities of the euro is its sensitivity not only to macroeconomic statistics but also to the news from various EU countries.

The new currency started circulating without cash on January 1st, 1999; coins and banknotes appeared on January 1st, 2002. In terms of usage for international payments, the euro is second to just the US dollar. It is also the second popular (alongside the USD) world’s reserve currency. At the official start of trades, the EUR/USD exchange rate was about 1.1800.

Since the beginning of trade in 1999, the rate has changed many times. For a couple of the first years, the perspectives of the euro remained vague, and the quotation was declining stably, reaching the minimum of 0.8200. Then the pair was growing for seven years, reaching its all-time high of 1.6000 in 2008. Later, the pair corrected significantly due to the banking crisis and various issues in the Eurozone. Currently, the pair is trading near 1.1300.

eurusd-1005x630.png


EUR/USD history price rate​

Characteristic features of the EUR/USD pair

EUR/USD is a major currency pair, characterized by increased liquidity. This is in no way surprising because it unites two main reserve currencies – the dollar and euro. These currencies make most of the volume of daily trades in Forex (about 20% of the overall volume).

The behavior of EUR/USD is some sort of an indicator demonstrating and comparing the economic situation in the US and Europe. If the US economy grows stably while the EU has some troubles, the EUR/USD pair falls. Conversely, if the USA slows down while the EU boasts good results, EUR/USD grows. Look at the main trading characteristics of the pair:

Active trading time: 24 hours a day except weekend; most active during the European and American trading sessions: this is the time for the main part of trades and important changes in EUR/USD.
Volatility: medium. At the publication of certain news, the EUR/USD pair still may swing by 100 points and more; however, on backtests, the average daily volatility of the pair is about 80 points.
Spread: this is one of the main advantages of the EUR/USD pair. Thanks to super-high liquidity, the spread is minimal. On popular ECN accounts, spread normally remains under 1 point.

Read more at R Blog - RoboForex

Sincerely,
RoboForex team
 
RoboForex: excellent conditions for Indices and a new asset, JP225

rf-news__indicies-nikkei.jpg


Dear Clients and Partners,​

RoboForex has expanded the list of instruments available for trading by adding a CFD on the major Japanese stock index called JP225. Indices rank among the most popular instruments of the OTC market, so don’t miss the opportunity to invest in them on attractive conditions.

Exclusive conditions for trading Indices at RoboForex:

  • Average spread for DE30Cash on ECN and Prime accounts – 0.5 EUR.
  • Fast order execution – from 0.1 seconds.
  • Minimum lot and volume step – 0.01.
  • Commission for the trading volume of 1 million USD – from 4 USD depending on the account type.
Indices can be traded on MetaTrader 4/5-based Pro-Standard, ECN, and Prime accounts, as well as through our multi-asset terminal R Trader.

Invest in DE30Cash, JP225Cash, US30Cash, US500Cash, USTECHCash, and other indices with high execution speed and the lowest spreads available.

Sincerely,
RoboForex team
 

Latest Posts

Live Forex Chart

Currency
Rates
EUR / USD
1.11555
USD / JPY
158.627
GBP / USD
1.32078
USD / CHF
0.83471
USD / CAD
1.42822
EUR / JPY
176.956
AUD / USD
0.69586
Back
Top
Log in Register