Antony_NPBFX
Active Member
- Messages
- 1,243
- Joined
- Aug 2, 2016
- Messages
- 1,243
- Reaction score
- 8
- Points
- 35
WTI Crude Oil: oil prices are in correction 23.12.2019
Good afternoon, dear forum visitors!
NPBFX offers the latest release of analytics on WTI Crude Oil for a better understanding of the current market situation and more efficient trading.
Current trend
Today, during the Asian session, oil prices show a negative trend, continuing to develop a “bearish” impulse formed at the end of last week. The instrument is supported by a decrease in trade tension between the US and China after the parties announced that they would sign a trade agreement in the first half of January. Investors expect that this step will contribute to a moderate increase in demand for petroleum products, which, along with the OPEC+ policy, may provide significant support for prices for “black gold”.
Prices are under pressure by Friday’s report of Baker Hughes, which indicated a sharp increase in the number of rigs for the week of December 20. The indicator increased by 18 units to 685 units, which was the most powerful growth since February 2018.
Support and resistance
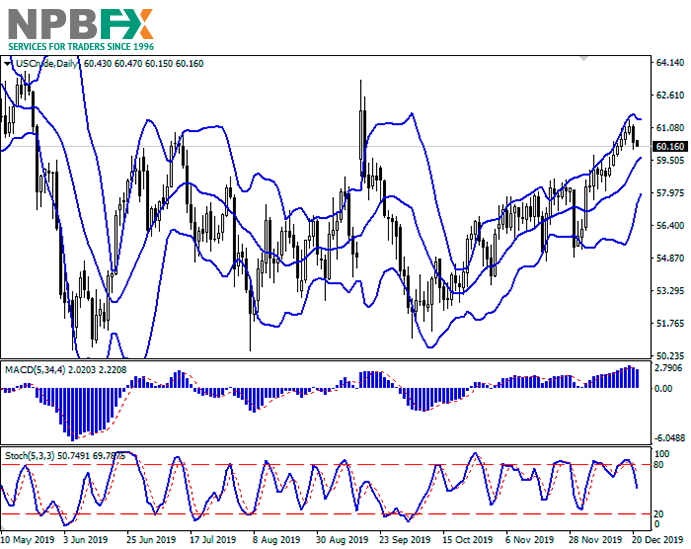
On the daily chart, Bollinger bands are growing moderately. The price range is narrowing, reflecting the appearance of correctional dynamics in the ultra-short term. The MACD indicator has reversed downward, having formed a new sell signal (the histogram is below the signal line). Stochastic’s dynamic is similar, it is currently located in the middle of its workspace.
Current readings of technical indicators do not contradict the further development of the downtrend in the short and/or ultra-short term.
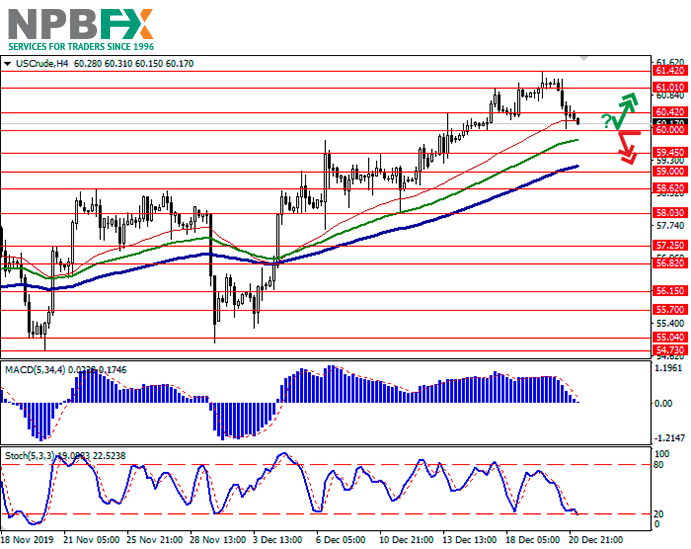
Resistance levels: 60.42, 61.01, 61.42.
Support levels: 60.00, 59.45, 59.00, 58.62.
Trading tips
Long positions may be opened after a rebound from the level of 60.00 and a breakout of the level of 60.42 with the target at 61.42. Stop loss – 59.80–59.60.
Short positions may be opened after the breakdown of the level of 60.00 with the target at 59.00 or 58.62. Stop loss – 60.75.
Implementation period: 2–3 days.
Use more opportunities of the NPBFX analytical portal: trading signals for commodities
How can a trader determine if it’s worth buying or selling WTI Crude Oil now or better waiting for a more favorable period? Use trading signals for commodities from the top 10 technical indicators on the NPBFX portal and make the right decisions! All registered users have free and unlimited access to the minutely updated trading signals (MA10, BBands, Ichimoku, Stochastic, ZigZag, etc.) for Gold, Silver, Brent and WTI Crude oil.
If you have any questions about trading instruments, you can always ask an analyst in the online chat on the portal and get a free consultation of an experienced specialist.
Use the current recommendations of analysts on WTI Crude Oil and trade efficiently with NPBFX.
Good afternoon, dear forum visitors!
NPBFX offers the latest release of analytics on WTI Crude Oil for a better understanding of the current market situation and more efficient trading.
Current trend
Today, during the Asian session, oil prices show a negative trend, continuing to develop a “bearish” impulse formed at the end of last week. The instrument is supported by a decrease in trade tension between the US and China after the parties announced that they would sign a trade agreement in the first half of January. Investors expect that this step will contribute to a moderate increase in demand for petroleum products, which, along with the OPEC+ policy, may provide significant support for prices for “black gold”.
Prices are under pressure by Friday’s report of Baker Hughes, which indicated a sharp increase in the number of rigs for the week of December 20. The indicator increased by 18 units to 685 units, which was the most powerful growth since February 2018.
Support and resistance
On the daily chart, Bollinger bands are growing moderately. The price range is narrowing, reflecting the appearance of correctional dynamics in the ultra-short term. The MACD indicator has reversed downward, having formed a new sell signal (the histogram is below the signal line). Stochastic’s dynamic is similar, it is currently located in the middle of its workspace.
Current readings of technical indicators do not contradict the further development of the downtrend in the short and/or ultra-short term.
Resistance levels: 60.42, 61.01, 61.42.
Support levels: 60.00, 59.45, 59.00, 58.62.
Trading tips
Long positions may be opened after a rebound from the level of 60.00 and a breakout of the level of 60.42 with the target at 61.42. Stop loss – 59.80–59.60.
Short positions may be opened after the breakdown of the level of 60.00 with the target at 59.00 or 58.62. Stop loss – 60.75.
Implementation period: 2–3 days.
Use more opportunities of the NPBFX analytical portal: trading signals for commodities
How can a trader determine if it’s worth buying or selling WTI Crude Oil now or better waiting for a more favorable period? Use trading signals for commodities from the top 10 technical indicators on the NPBFX portal and make the right decisions! All registered users have free and unlimited access to the minutely updated trading signals (MA10, BBands, Ichimoku, Stochastic, ZigZag, etc.) for Gold, Silver, Brent and WTI Crude oil.
If you have any questions about trading instruments, you can always ask an analyst in the online chat on the portal and get a free consultation of an experienced specialist.
Use the current recommendations of analysts on WTI Crude Oil and trade efficiently with NPBFX.