BTC USD 86,036.2 Gold USD 4,187.36
Time now: Jun 1, 12:00 AM

NPBFX - npbfx.com

WTI Crude Oil: oil prices are consolidating 23.09.2019

Good afternoon, dear forum visitors!

NPBFX offers the latest release of analytics on WTI Crude Oil for a better understanding of the current market situation and more efficient trading.

Current trend

Oil prices rose slightly on Friday, but returned to negative dynamics closer to the end of the afternoon session. Quotes are supported by rising tensions in the Middle East after an attack on key oil production facilities in Saudi Arabia the week before last. The Kingdom announced a military operation north of the city of Hodeidah, while Donald Trump approved sending of troops to Saudi Arabia to strengthen defense capabilities. In addition, it became known that Riyadh is actively importing oil production equipment from the United States, so that by the end of the month most of the stopped facilities can be restored. Baker Hughes report released last Friday indicated a sharp decrease in the number of active oil rigs in the US from 733 to 719 rigs, which also provided significant support for quotes.

Support and resistance

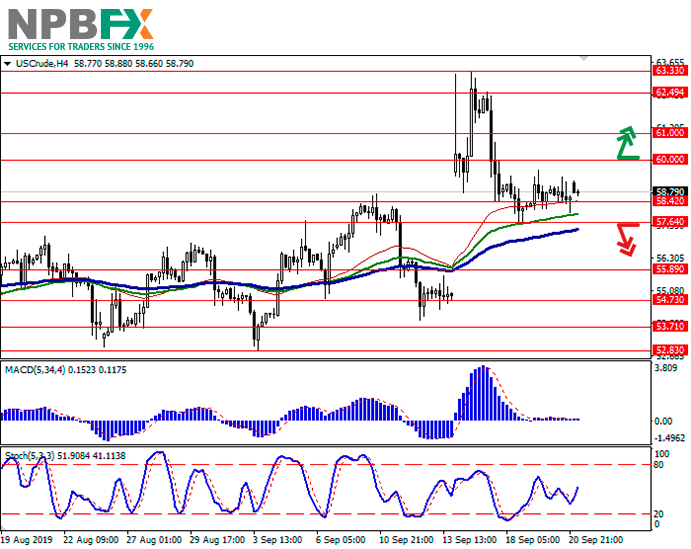
Bollinger Bands in D1 chart show stable growth. The price range is narrowing, reflecting the emergence of ambiguous dynamics of trading in the short term. MACD is growing, keeping a weak buy signal (located above the signal line). Stochastic is going down, approaching the level of “20”, which is the formal border of the oversold instrument. It is necessary to wait until the situation becomes clear and updated trading signals from technical indicators appear in order to open new market positions.

Resistance levels: 60.00, 61.00, 62.49, 63.33.

Support levels: 58.42, 57.64, 55.89, 54.73.
oil-3-1.png


oil-4-1.png


Trading tips

To open long positions, one can rely on the breakout of 60.00. Take profit — 63.33. Stop loss — 58.42.

The return of “bearish” trend with the breakdown of 57.64 may become a signal for new sales with the target at 54.73 or 53.71. Stop-loss — 59.50.

Implementation time: 2-3 days.

Use more opportunities of the NPBFX analytical portal: trading signals for commodities

How can a trader determine if it’s worth buying or selling WTI Crude Oil now or better waiting for a more favorable period? Use trading signals for commodities from the top 10 technical indicators on the NPBFX portal and make the right decisions! All registered users have free and unlimited access to the minutely updated trading signals (MA10, BBands, Ichimoku, Stochastic, ZigZag, etc.) for Gold, Silver, Brent and WTI Crude oil.

If you have any questions about trading instruments, you can always ask an analyst in the online chat on the portal and get a free consultation of an experienced specialist.

Use the current recommendations of analysts on WTI Crude Oil and trade efficiently with NPBFX.
 
AUD/USD: the instrument is trading in both directions 25.09.2019

Good afternoon, dear forum visitors!

NPBFX offers the latest release of analytics on AUD/USD for a better understanding of the current market situation and more efficient trading.

Current trend

The Australian dollar strengthened significantly against the US currency on Tuesday, recovering from an uncertain start of the week. The instrument was supported by the results of a speech by RBA head Philip Lowe, who expressed optimism regarding the future prospects of the Australian economy, which, in his opinion, will demonstrate steady growth in the near future, but no significant acceleration should be expected. A positive effect should be achieved by a tax refund, which will increase income from households. Regarding the prospects for monetary policy, Lowe still takes a “dovish” position and believes that in the future the Australian economy may need an additional rate cut.

During today's Asian session, the instrument again shows a steady decline, losing positions earned the day before.

Support and resistance

Bollinger Bands in D1 chart demonstrate an unsteady decrease. The price range is expanding, reflecting increased trading activity this week. MACD is going down preserving a previous sell signal (located below the signal line). Stochastic, by contrast, maintains an uptrend, having reversed close to its lows at the beginning of the week. The indicator still points at the oversold AUD in the ultra-short term.

One should wait for clarification of the situation to open new transactions.

Resistance levels: 0.6807, 0.6829, 0.6858, 0.6883.

Support levels: 0.6777, 0.6759, 0.6734, 0.6700.

aud-3-1.png


aud-4-1.png


Trading tips

To open long positions, one can rely on the rebound from 0.6777 as from support with the subsequent breakout of 0.6807. Take profit — 0.6858 or 0.6883. Stop loss — 0.6777.

The breakdown of 0.6777 may serve as a signal to new sales with the target at 0.6700. Stop loss — 0.6807.

Implementation time: 2-3 days.

Use more opportunities of the NPBFX analytical portal: economic calendar

Be ready for any market changes through global events using the economic calendar on the NPBFX portal. The calendar contains all the most important events of the world economy and prognoses for them. In order to get free and unlimited access to the economic calendar and other useful instruments on the portal, you need to pass a one-time registration on the NPBFX website.

If you have any questions about trading instruments, you can always ask an analyst in the online chat on the portal and get a free consultation of an experienced specialist.

Use the current recommendations of analysts on AUD/USD and trade efficiently with NPBFX.
 
GBP/USD: the pound remains under pressure 27.09.2019

Good afternoon, dear forum visitors!

NPBFX offers the latest release of analytics on GBP/USD for a better understanding of the current market situation and more efficient trading.

Current trend

The British pound remains downward paired with the US currency, updating local lows of September 12. The main factor contributing to the decline in the pound remains the uncertain situation around Brexit. There is less and less time for concluding a final agreement with the EU, while Prime Minister Boris Johnson and the British Parliament are engaged in an internal political struggle. Johnson reaffirmed his position regarding the request for an additional delay from the EU, despite the fact that non-compliance with the adopted law threatens him with a prison.

Today, the pair is trading in both directions. Slight support for the pound is provided by data on Gfk Consumer Confidence. In September, the indicator rose from –14 to –12 points, which turned out to be better than expectations of –14 points.

Support and resistance

Bollinger Bands in the D1 chart demonstrate flat dynamics. The price range consolidated within rather narrow boundaries, which, however, correspond to the observed dynamics in the market. MACD is going down preserving a stable sell signal (located below the signal line). Stochastic keeps a confident downward direction but is located near its lows, which indicates the oversold pound in the ultra-short term.

Existing short positions should be kept until the situation clears up.

Resistance levels: 1.2384, 1.2450, 1.2503, 1.2556, 1.2600.

Support levels: 1.2301, 1.2248, 1.2200, 1.2154.

gbp-3-1.png


gbp-4-1.png


Trading tips

To open long positions, one can rely on the rebound from the support level of 1.2301 with the subsequent breakout of 1.2384. Take profit — 1.2556 or 1.2600. Stop loss — 1.2301.

A confident breakdown of 1.2301 may become a signal to further sales with target at 1.2154 or 1.2130, 1.2100. Stop loss — 1.2384.

Implementation time: 2-3 days.

Use more opportunities of the NPBFX analytical portal: E-book

If you just recently started to be interested in trading on FOREX and would like to deepen your knowledge, an electronic Beginner's Guide to FOREX Trading will be an excellent helper for you here. The book consists of 5 chapters and reflects fundamental concepts of the foreign exchange market to start successful trading. From the main chapters of the E-book you can learn about the concepts and history of FOREX, currencies and trend lines, technical indicators, types of orders, trading on news, psychology of trading, risk management and much more.

You can read a Beginner's guide to FOREX Trading online or download it free of charge from the NPBFX analytical portal in the "Education" section. In order to get unlimited access to the E-book and other useful instruments on the portal, you need to register on the NPBFX website.

If you have any questions about trading instruments, you can always ask an analyst in the online chat on the portal and get a free consultation of an experienced specialist.

Use the current recommendations of analysts on GBP/USD and trade efficiently with NPBFX.
 
XAU/USD: gold prices are falling 30.09.2019

Good afternoon, dear forum visitors!

NPBFX offers the latest release of analytics on XAU/USD for a better understanding of the current market situation and more efficient trading.

Current trend

At the end of last week, gold prices fell, renewing weekly lows. The reason for the further weakening of the precious metal was the strong position of the American currency, which is growing moderately against a number of its competitors, namely, the euro. Negative macroeconomic statistics published in the USA at the end of last week contributed to some correction of the instrument closer to the close of Friday afternoon session, however, the general “bearish” mood remained.

Improving the prospects for US-Chinese trade negotiations, which should resume in Washington in early October, also help reduce demand for the shelter asset.

Support and resistance

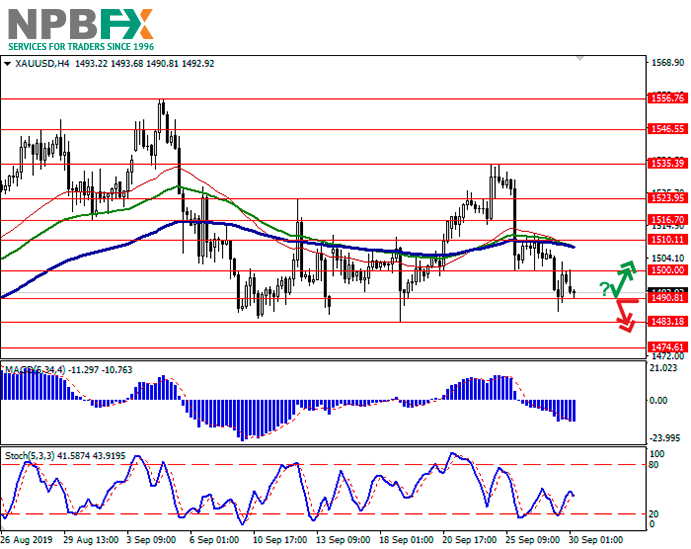
On the daily chart, Bollinger bands are moving flat. The price range is slightly narrowing from below, reflecting the uncertain nature of trading. The MACD indicator goes downwards, keeping a strong sell signal (the histogram is below the signal line), and is preparing for a breakdown of the zero line. Stochastic is decreasing, however, it is rapidly approaching its lows, which indicates that gold may become oversold in the very short term.

It is better to keep the current short positions in the short and/or ultra-short term.

Resistance levels: 1500.00, 1510.11, 1516.70, 1523.95.

Support levels: 1490.81, 1483.18, 1474.61.

xau-3-1.png


xau-4.png


Trading tips

Long positions can be opened after a rebound from the level of 1490.81 and a breakout of the level of 1500.00 with the target at 1523.95 or 1535.39. Stop loss is 1483.18.

Short positions can be opened after the breakdown of the level of 1490.81 with the target at 1474.61 or 1460.00. Stop loss is 1500.00 or 1508.00.

Implementation period: 2–3 days.

Use more opportunities of the NPBFX analytical portal: trading signals for commodities

How can a trader determine if it’s worth buying or selling XAU/USD now or better waiting for a more favorable period? Use trading signals for commodities from the top 10 technical indicators on the NPBFX portal and make the right decisions! All registered users have free and unlimited access to the minutely updated trading signals (MA10, BBands, Ichimoku, Stochastic, ZigZag, etc.) for Gold, Silver, Brent and WTI Crude oil.

If you have any questions about trading instruments, you can always ask an analyst in the online chat on the portal and get a free consultation of an experienced specialist.

Use the current recommendations of analysts on XAU/USD and trade efficiently with NPBFX.
 
USD/CAD: dollar is down 02.10.2019

Good afternoon, dear forum visitors!

NPBFX offers the latest release of analytics on USD/CAD for a better understanding of the current market situation and more efficient trading.

Current trend

Yesterday, the USD/CAD pair fell, although during the day the instrument was trading mainly in an upward direction.

USD is under pressure of poor Manufacturing PMI. According to ISM data, the indicator for September fell from 49.1 to 47.8 points against the forecast of 50.1 points. In turn, the Canadian PMI indicator came out better than its forecasts. In the manufacturing sector, the index for September grew from 49.1 to 51.0 points against the market forecast of 50.4 points. A more confident growth of the Canadian dollar was hindered by poor data on Canada's GDP dynamics for July. In monthly terms, the growth rate of the Canadian economy slowed from +0.2% MoM to +0.0% MoM against the forecast of +0.1% MoM.

Support and resistance

On the daily chart, Bollinger bands move flat. The price range expands but not as fast as the “bearish” dynamics develop. MACD falls, keeping a poor sell signal (the histogram is below the signal line), and tries to consolidate below the zero line. Stochastic declines, keeping a confident “bearish” momentum, and rapidly approaches its lows, which indicates that USD may become oversold in the ultra-short term.

It is better to keep the current short positions and open new ones in the short and/or ultra-short term until the current sell signals from technical indicators are canceled.

Resistance levels: 1.3224, 1.3244, 1.3267, 1.3289.

Support levels: 1.3200, 1.3163, 1.3132, 1.3100.

cad-3.png


cad-4.png


Trading tips

Long positions can be opened after the rebound from 1.3200 and the breakout of 1.3224 with the target at 1.3289 or 1.3309. Stop loss – 1.3180.

Short positions can be opened after the breakdown of 1.3200 with the target at 1.3132 or 1.3100. Stop loss – 1.3240.

Implementation period: 2–3 days.

Use more opportunities of the NPBFX analytical portal: analytics

You can find more actual analytical reviews on other popular currency pairs, metals and CFDs on the NPBFX online portal. Daily analytics with charts, current market prognoses and trading scenarios in the Feed section are available. Get free and unlimited access to the online portal after registering on the official website of NPBFX Company.

If you have any questions about trading instruments, you can always ask an analyst in the online chat on the portal and get a free consultation of an experienced specialist.

Use the current recommendations of analysts on USD/CAD and trade efficiently with NPBFX.
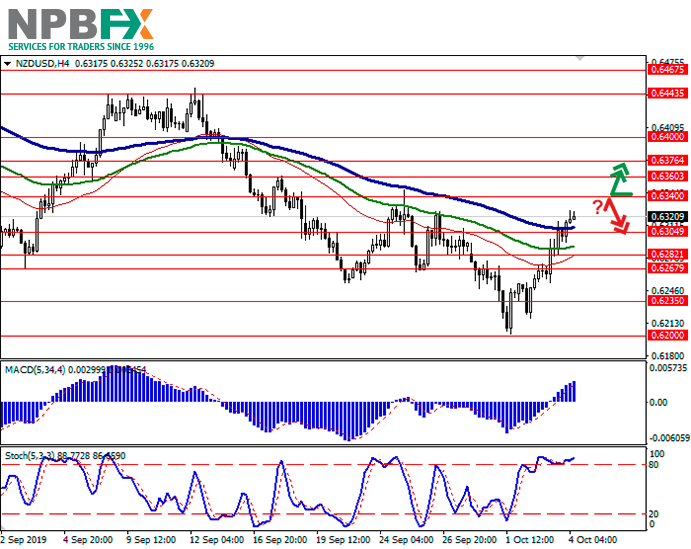
 
NZD/USD: New Zealand dollar strengthens 04.10.2019

Good afternoon, dear forum visitors!

NPBFX offers the latest release of analytics on NZD/USD for a better understanding of the current market situation and more efficient trading.

Current trend

Yesterday, the NZD/USD pair rose moderately, as the US dollar weakened to the entire spectrum of the market after the publication of ISM Service PMI data. For September, the indicator fell from 56.4 to 52.6 points against the forecast of 55.0 points. On October 1, ISM Manufacturing PMI also fell sharply to the lowest levels since 2009.

Today, during the Asian session, the New Zealand dollar continues to grow actively. The pressure on the US currency remains before the publication of the September report on the labor market, which, according to some analysts, could have a decisive influence on the Fed in the issue of another rate cut this year.

Support and resistance

On the daily chart, Bollinger Bands reverse into the horizontal plane. The price range narrows, reflecting a smooth upward movement of the instrument. The MACD indicator is growing, keeping a relatively strong buy signal (the histogram is above the signal line). Stochastic is growing almost vertically, however, it is approaching its highs, which limits the prospects for the development of the “bullish” trend in the ultra-short term.

The current indicators do not contradict the further development of the upward trend in the instrument.

Resistance levels: 0.6340, 0.6360, 0.6376, 0.6400.

Support levels: 0.6304, 0.6282, 0.6267, 0.6235.

nzd-3.png


nzd-4.png


Trading tips

Long positions can be opened after the breakout of the level of 0.6340 with the target at 0.6400. Stop loss – 0.6304.

Short positions can be opened after a rebound from the level of 0.6340 and a breakdown of the level of 0.6304 with the target at 0.6235 or 0.6200. Stop loss —0.6340–0.6360.

Implementation period: 2–3 days.

Use more opportunities of the NPBFX analytical portal: glossary

Beginning traders certainly face a lot of specialized concepts and lexicon on FOREX, which are often not fully been understood. Swap, tick, hedge, margin calls are often unfamiliar to beginning traders. But the lack of knowledge of these fundamentals make a competent market vision impossible. So glossary on the NPBFX analytical portal could be an excellent helper in this case, which contains all the main definitions with explanations in a compact and accessible form. All concepts are arranged in alphabetical order, so that you can easily and quickly find and explore a new concept for yourself.

If you have any questions about trading instruments, you can always ask an analyst in the online chat on the portal and get a free consultation of an experienced specialist.

Use the current recommendations of analysts on NZD/USD and trade efficiently with NPBFX.
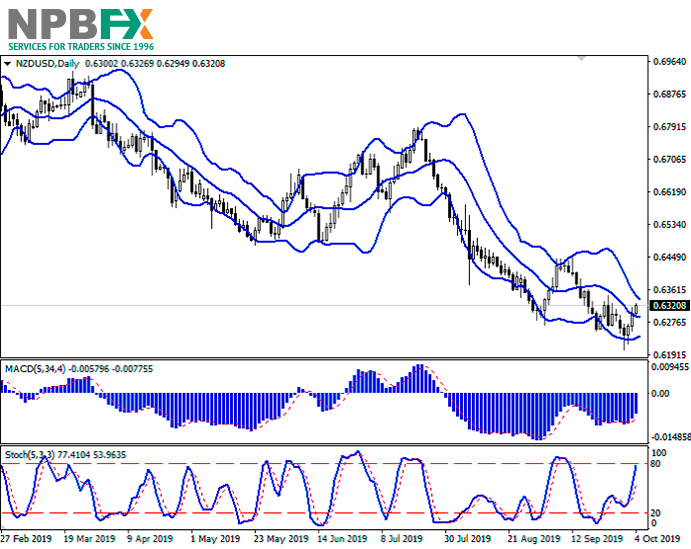
 
GBP/USD: the pound is trading in both directions 07.10.2019

Good afternoon, dear forum visitors!

NPBFX offers the latest release of analytics on GBP/USD for a better understanding of the current market situation and more efficient trading.

Current trend

The British pound showed ambiguous dynamics against the US dollar on Friday, reacting to the publication of an ambiguous report on the US labor market. In addition, investors are quite alarmed by the events around Brexit. Boris Johnson sent a new version of the agreement to Brussels, which provides for rather radical solutions to the problem with the Irish border. In particular, it proposed to create an all-island regulatory zone on the Island of Ireland, which will ensure the necessary customs control. The EU was optimistic about the UK's new proposals, but pointed out that a number of problems remained. However, until the UK has a clear agreement with the EU, the probability of a hard Brexit remains.

Support and resistance

Bollinger Bands in D1 chart demonstrate a gradual decrease. The price range is slightly narrowed from above, reflecting the flat dynamics of trading in recent days. MACD indicator is gradually reversing upwards forming a new buy signal (the histogram has to consolidate above the signal line). The indicator is about to test the zero line for a breakout. Stochastic slowed down its growth and reversed into a horizontal plane, reacting to the contradictory dynamics of last Friday.

One should wait for clarification of the situation to open new transactions.

Resistance levels: 1.2343, 1.2384, 1.2450, 1.2503.

Support levels: 1.2253, 1.2200, 1.2154, 1.2077.

gpb-3.png


gbp-4.png


Trading tips

To open long positions, one can rely on the breakout of 1.2343. Take profit — 1.2503 or 1.2556. Stop loss — 1.2280. Implementation time: 1-2 days.

A breakdown of 1.2253 may be a signal for new sales with target at 1.2037 or 1.2000. Stop loss — 1.2343. Implementation time: 2-3 days.

Use more opportunities of the NPBFX analytical portal: economic indicators

Regular monitoring of global economic indicators plays an important role in trading, because of their strong influence on FOREX market and possibility to provoke significant price fluctuations. For the convenience of traders the "Education" section on the NPBFX portal contains the most popular and significant world economic indices with a detailed description, their possible impact on the economy and exchange rates (GDP, consumer price index, unemployment rate, Nonfarm Payrolls (NFP), etc.).

If you have any questions about trading instruments, you can always ask an analyst in the online chat on the portal and get a free consultation of an experienced specialist.

Use the current recommendations of analysts on GBP/USD and trade efficiently with NPBFX.
 
EUR/USD: the euro is declining 09.10.2019

Good afternoon, dear forum visitors!

NPBFX offers the latest release of analytics on EUR/USD for a better understanding of the current market situation and more efficient trading.

Current trend

The European currency showed a moderate decline against the US dollar on Tuesday, continuing to develop a "bearish" impulse formed the day before. Pressure on the euro was exerted by ambiguous statistics on industrial production in Germany. On a monthly basis, production grew by 0.3% MoM in August after a decrease of 0.4% MoM in the previous month. Analysts had expected a decline of 0.3% MoM. However, in annual terms, production volumes only accelerated their decline from the previous –3.9% YoY to –4.0% YoY, which turned out to be significantly worse than expectations of –2.7% YoY.

Another negative factor for the instrument remains the situation around the Brexit process. It became known the day before that Germany opposed Boris Johnson’s new plan to solve the problem with the Irish border, which significantly reduces the chances of concluding a final agreement before the end of October.

Support and resistance

Bollinger Bands in D1 chart demonstrate a stable decrease. The price range is narrowing, reflecting the emergence of ambiguous dynamics of trading in the short term. MACD is gradually reversing downwards keeping a previous buy signal (located above the signal line). Stochastic is quite actively decreasing, having rebounded from the "80" level. The indicator signals in favor of the development of corrective decline in the ultra-short term.

It is worth looking into the possibility of the downtrend development in the short and/or ultra-short term.

Resistance levels: 1.0982, 1.1000, 1.1028, 1.1050.

Support levels: 1.0947, 1.0924, 1.0903, 1.0878.

eur-3.png


eur-4.png


Trading tips

To open long positions, one can rely on the breakout of 1.0982. Take profit — 1.1050. Stop loss — 1.0950.

The return of "bearish" trend with the breakdown of 1.0947 may become a signal for new sales with the target at 1.0878. Stop loss — 1.0982.

Implementation time: 2-3 days.

Use more opportunities of the NPBFX analytical portal: weekly FOREX forecast

You can learn more about the current situation on EUR/USD and get acquainted with the weekly analytical forecast in the "Video reviews" section on the NPBFX portal. Weekly video reviews contain trends, key levels, trading recommendations for such popular instruments as EUR/USD, GBP/USD, USD/JPY, AUD/USD. In order to get free and unlimited access to video forecast and other useful instruments on the portal, you need to register on the NPBFX website.

If you have any questions about trading instruments, you can always ask an analyst in the online chat on the portal and get a free consultation of an experienced specialist.

Use the current recommendations of analysts on EUR/USD and trade efficiently with NPBFX.
 
USD/JPY: USD is strengthening 11.10.2019

Good afternoon, dear forum visitors!

NPBFX offers the latest release of analytics on USD/JPY for a better understanding of the current market situation and more efficient trading.

Current trend

The US dollar rose significantly against the Japanese yen on Thursday, updating local highs of October 1. The development of the "bullish" dynamics of the instrument was facilitated by a noticeable decline in interest in safe assets in the market amid some progress on trade negotiations between the US and China. In addition, investors are optimistic about Brexit news. Macroeconomic statistics from the US and Japan released yesterday turned out to be ambiguous.

Macroeconomic statistics from the US and Japan released yesterday turned out to be ambiguous. The Japanese Core Machinery Orders in August showed a decrease of 14.5% YoY after an increase of 0.3% YoY last month. Analysts expected negative dynamics, but only at –10.8% YoY. In monthly terms, the indicator decreased by 2.4% MoM after a decrease of 6.6% MoM last month. The forecast was –2.5% MoM.

Support and resistance

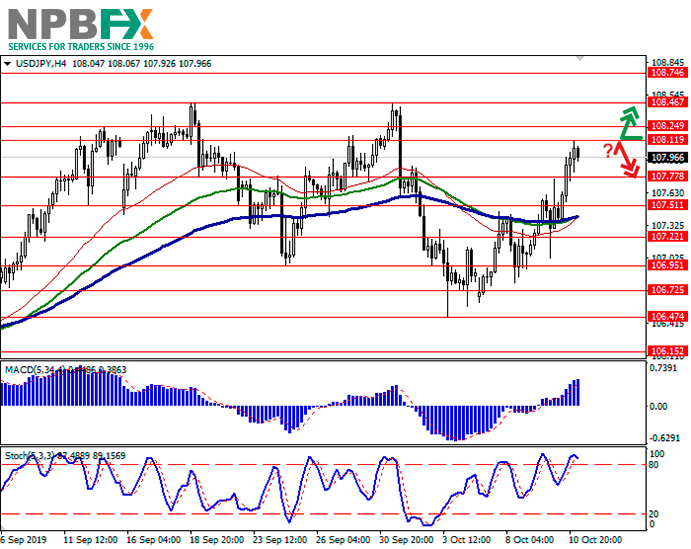
Bollinger Bands in D1 chart show moderate growth. The price range expands from above, freeing a path to new local highs for the "bulls". MACD indicator is growing keeping a fairly stable buy signal (located above the signal line). Stochastic retains upward direction, but is located near its highs, which indicates risks of correctional decline in the ultra-short term.

Existing long positions should be kept until the situation clears up.

Resistance levels: 108.11, 108.24, 108.46, 108.74.

Support levels: 107.77, 107.51, 107.22, 106.95.

jpy-3.png


jpy-4.png


Trading tips

To open long positions, one can rely on the breakout of 108.11 or 108.24. Take profit — 108.74 or 109.00. Stop loss — 108.00 or 107.77.

The rebound from 108.11 as from resistance with the subsequent breakdown of 107.90 or 107.77 can become a signal to correctional sales with target at 107.22 or 106.95. Stop loss — 108.11 or 108.24.

Implementation time: 2-3 days.

Use more opportunities of the NPBFX analytical portal: economic calendar

Be ready for any market changes through global events using the economic calendar on the NPBFX portal. The calendar contains all the most important events of the world economy and prognoses for them. In order to get free and unlimited access to the economic calendar and other useful instruments on the portal, you need to pass a one-time registration on the NPBFX website.

If you have any questions about trading instruments, you can always ask an analyst in the online chat on the portal and get a free consultation of an experienced specialist.

Use the current recommendations of analysts on USD/JPY and trade efficiently with NPBFX.
 
AUD/USD: the instrument is growing 14.10.2019

Good afternoon, dear forum visitors!

NPBFX offers the latest release of analytics on AUD/USD for a better understanding of the current market situation and more efficient trading.

Current trend

The Australian dollar showed strong growth against the US currency on Friday, updating local highs of September 19. The instrument is supported by positive prospects for concluding a trade agreement between the United States and China. On Friday, the first round of new negotiations ended, following which it was decided to postpone the introduction of import duties on Chinese goods until mid-December. Donald Trump said that “the first phase of the deal was completed,” however, the final preparation of documents will take a little more than a month. China, as previously planned, will noticeably increase imports of American agricultural products by 40-50 billion dollars a year. At the same time, the markets were somewhat disappointed by the absence of Huawei situation on the agenda.

Support and resistance

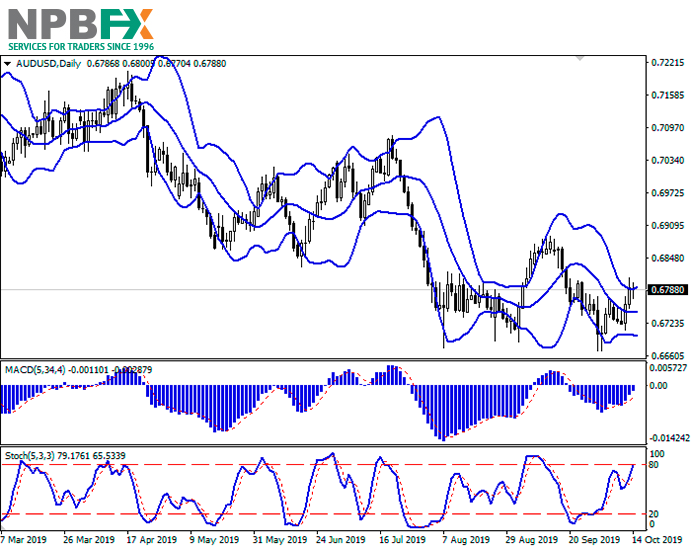
Bollinger Bands in the D1 chart demonstrate flat dynamics. The price range is expanding, reflecting a strong “bullish” impact in the short term. MACD indicator is growing, keeping a stable buy signal (located above the signal line). Stochastic is growing, approaching its highs, signaling about the risks of overbought AUD in the ultra-short term.

One should keep existing long positions in the short and/or ultra-short term.

Resistance levels: 0.6809, 0.6829, 0.6858, 0.6883.

Support levels: 0.6779, 0.6759, 0.6738, 0.6717.

aud-3.png


aud-4.png


Trading tips

To open long positions, one can rely on the breakout of 0.6809. Take profit — 0.6883 or 0.6900. Stop loss — 0.6779 or 0.6765.

A breakdown of 0.6759 may become a signal to new sales with target at 0.6700 or 0.6669. Stop loss — 0.6790.

Implementation time: 2-3 days.

Use more opportunities of the NPBFX analytical portal: E-book

If you just recently started to be interested in trading on FOREX and would like to deepen your knowledge, an electronic Beginner's Guide to FOREX Trading will be an excellent helper for you here. The book consists of 5 chapters and reflects fundamental concepts of the foreign exchange market to start successful trading. From the main chapters of the E-book you can learn about the concepts and history of FOREX, currencies and trend lines, technical indicators, types of orders, trading on news, psychology of trading, risk management and much more.

You can read a Beginner's guide to FOREX Trading online or download it free of charge from the NPBFX analytical portal in the "Education" section. In order to get unlimited access to the E-book and other useful instruments on the portal, you need to register on the NPBFX website.

If you have any questions about trading instruments, you can always ask an analyst in the online chat on the portal and get a free consultation of an experienced specialist.

Use the current recommendations of analysts on AUD/USD and trade efficiently with NPBFX.
 

Latest Posts

Live Forex Chart

Currency
Rates
EUR / USD
1.12602
USD / JPY
157.828
GBP / USD
1.32134
USD / CHF
0.82906
USD / CAD
1.42212
EUR / JPY
177.449
AUD / USD
0.69427
Back
Top
Log in Register