BTC USD 84,524.3 Gold USD 4,285.49
Time now: Jun 1, 12:00 AM

NPBFX - npbfx.com

XAU/USD: gold is declining 24.08.2018

Good afternoon, dear forum visitors!

NPBFX offers the latest release of analytics on the XAU/USD for a better understanding of the current market situation and more efficient trading.

Current trend

Yesterday, gold prices declined in response to the resumed growth of USD due to the increase in the US bonds’ yield. In addition, investors reacted positively to FOMC Minutes, which confirmed the readiness of the regulator to raise the interest rate at the September meeting.

The escalation of the trade conflict between the US and China also provides more support for the safe dollar than gold. Yesterday new reciprocal duties were implemented, as there was no noticeable progress in negotiations in Washington.

Today, investors are waiting for the speech of Fed Chairman Jerome Powell within the symposium in Jackson Hole. He will provide a report on monetary policy in a changing economy. Also, the market is waiting for the comments of the regulator's head regarding the latest critical statements of President Trump.

Support and resistance

On the daily chart, Bollinger bands are steadily declining. The price range is slightly narrowed from above, reflecting the recent ambiguous trade. MACD indicator grows, maintaining the buy signal (the histogram is above the signal line). Stochastic reversed downwards, reflecting the risks of corrective dynamics of overbought gold development.

It is better to keep current short positions in the short and/or short-term perspective until new trade signals appear.

Resistance levels: 1191.36, 1200.00, 1204.55, 1211.14.

Support levels: 1182.79, 1170.00, 1159.83.

240813.png


240823.png


Trading tips

Long positions can be opened after a rebound from the level of 1182.79 and breakout of the level 1191.36 with the target at 1211.14 or 1215.79. Stop loss is 1182.79. Implementation period: 2–3 days.

Short positions can be opened after the breakdown of level 1182.79 with the target at 1170.00. Stop loss is 1191.36. Implementation period: 1–2 days.

Use more opportunities of the NPBFX analytical portal: trading signals

Make right trade decisions on sell or buy XAU/USD and other popular instruments using trading signals on the NPBFX portal. All registered users have free access to signals from the top 10 trading indicators (MA10, BBands, Ichimoku, Stochastic, ZigZag, etc.) with also general recommendations on the portal.

If you have any questions about trading instruments, you can always ask an analyst in the online chat on the portal and get a free consultation of an experienced specialist.

Use the current recommendations of analysts on XAU/USD and trade efficiently with NPBFX.
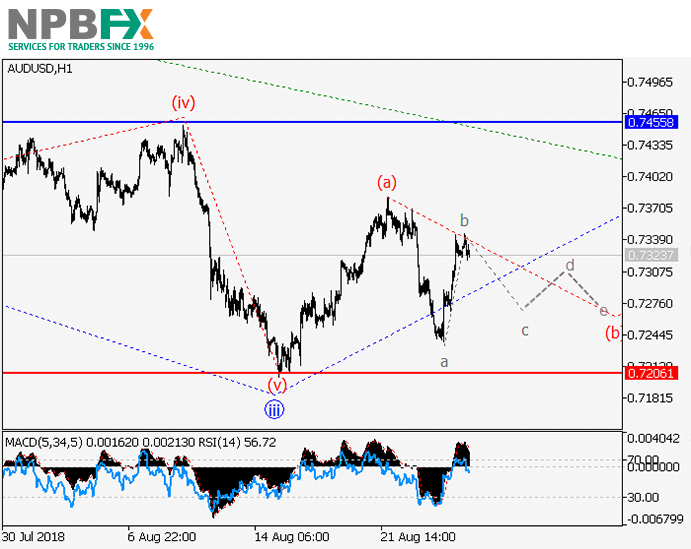
 
AUD/USD: wave analysis 27.08.2018

Good afternoon, dear forum visitors!

NPBFX offers the latest release of analytics on the AUD/USD for a better understanding of the current market situation and more efficient trading.

Current trend

The price can grow.

On the 4-hour chart, the first wave of the higher level 1 develops, within which the wave iii of 1 ended. Now the upward correction is developing as a fourth wave iv of 1, within which the wave (a) of iv has formed, and the wave (b) of iv is developing. If the assumption is correct, after the end of the wave the pair will grow to the level of 0.7455. In this scenario, critical stop loss level is 0.7206.

270813.png


270823.png


Main scenario

Long positions will become relevant during the correction, above the level of 0.7206 with the target at 0.7455. Implementation period: 5–7 days.

Alternative scenario

The breakdown and the consolidation of the price below the level of 0.7206 will let the pair go down to the level of 0.7100.

Use more opportunities of the NPBFX analytical portal: e-book

If you just recently started to be interested in trading on FOREX and would like to deepen your knowledge, an electronic Beginner's Guide to FOREX Trading will be an excellent helper for you here. The book consists of 5 chapters and reflects fundamental concepts of the foreign exchange market to start successful trading. From the main chapters of the E-book you can learn about the concepts and history of FOREX, currencies and trend lines, technical indicators, types of orders, trading on news, psychology of trading, risk management and much more.

You can read a Beginner's guide to FOREX Trading online or download it free of charge from the NPBFX analytical portal in the "Education" section. In order to get unlimited access to the E-book and other useful instruments on the portal, you need to register on the NPBFX website.

If you have any questions about trading instruments, you can always ask an analyst in the online chat on the portal and get a free consultation of an experienced specialist.

Use the current recommendations of analysts on AUD/USD and trade efficiently with NPBFX.
 
USD/CAD: wave analysis 29.08.2018

Good afternoon, dear forum visitors!

NPBFX offers the latest release of analytics on the USD/CAD for a better understanding of the current market situation and more efficient trading.

Current trend

The pair is in a correction, the fall is possible.

On the 4-hour chart, the downward correction develops as a wave 2. Now the wave a of 2 of the lower level is developing, within which the fifth wave (v) of a is forming. If the assumption is correct, the pair will fall to the levels of 1.2820–1.2740. In this scenario, critical stop loss level is 1.2992.

290813.png


290823.png


Main scenario

Short positions will become relevant during the correction, below the level of 1.2992 with the targets at 1.2820–1.2740. Implementation period: 3–5 days.

Alternative scenario

The breakout and the consolidation of the price above the level of 1.2992 will let the pair grow to the levels of 1.3140–1.3200.

Use more opportunities of the NPBFX analytical portal: glossary

Beginning traders certainly face a lot of specialized concepts and lexicon on FOREX, which are often not fully been understood. Swap, tick, hedge, margin calls are often unfamiliar to beginning traders. But the lack of knowledge of these fundamentals make a competent market vision impossible. So glossary on the NPBFX analytical portal could be an excellent helper in this case, which contains all the main definitions with explanations in a compact and accessible form. All concepts are arranged in alphabetical order, so that you can easily and quickly find and explore a new concept for yourself.

If you have any questions about trading instruments, you can always ask an analyst in the online chat on the portal and get a free consultation of an experienced specialist.

Use the current recommendations of analysts on USD/CAD and trade efficiently with NPBFX.
 
EUR/USD: wave analysis 31.08.2018

Good afternoon, dear forum visitors!

NPBFX offers the latest release of analytics on the EUR/USD for a better understanding of the current market situation and more efficient trading.

Current trend

The pair can grow.

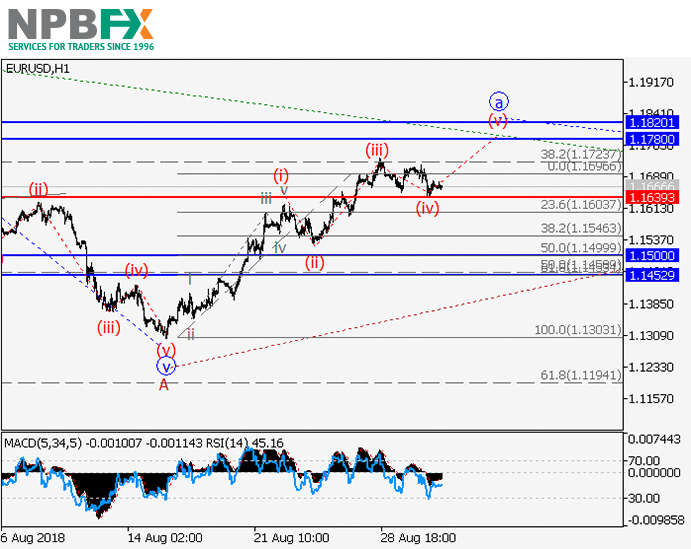
On the 4-hour chart, the downward momentum of the higher level A of (2) formed, and the development of the upward correction as a wave B of (2) begun. Now the wave a of B is developing, within which the fourth wave of the lower level (iv) of a has ended. If the assumption is correct, the pair will grow to the levels of 1.1780–1.1820. In this scenario, critical stop loss level is 1.1639.

38013.png


310823.png


Main scenario

Long positions will become relevant during the correction, above the level of 1.1639 with the targets at 1.1780–1.1820. Implementation period: 5–7 days.

Alternative scenario

The breakdown and the consolidation of the price below the level of 1.1639 will let the pair go down to the levels of 1.1500–1.1450.

Use more opportunities of the NPBFX analytical portal: economic indicators

Regular monitoring of global economic indicators plays an important role in trading, because of their strong influence on FOREX market and possibility to provoke significant price fluctuations. For the convenience of traders the "Education" section on the NPBFX portal contains the most popular and significant world economic indices with a detailed description, their possible impact on the economy and exchange rates (GDP, consumer price index, unemployment rate, Nonfarm Payrolls (NFP), etc.).

If you have any questions about trading instruments, you can always ask an analyst in the online chat on the portal and get a free consultation of an experienced specialist.

Use the current recommendations of analysts on EUR/USD and trade efficiently with NPBFX.
 
USD/JPY: wave analysis 03.09.2018

Good afternoon, dear forum visitors!

NPBFX offers the latest release of analytics on the USD/JPY for a better understanding of the current market situation and more efficient trading.

Current trend

The pair can grow.

On the 4-hour chart, the correction of the higher level formed as a wave 2 of (C), taken a shape of an irregular flat. Now the development of the third wave 3 of C has begun, within which the first entry wave of the lower level (i) of I has formed, and the correction (ii) of I is ending. If the assumption is correct, the pair will grow to the levels of 113.22–115.00. In this scenario, critical stop loss level is 109.74.

030913.png


030923.png


Main scenario

Long positions will become relevant during the correction, above the level of 109.74 with the targets at 113.22–115.00. Implementation period: 7 days and more.

Alternative scenario

The breakdown and the consolidation of the price below the level of 109.74 will let the pair go down to the level of 108.09.

Use more opportunities of the NPBFX analytical portal: analytics

You can find more actual analytical reviews on other popular currency pairs, metals and CFDs on the NPBFX online portal. Daily analytics with charts, current market prognoses and trading scenarios in the Feed section are available. Get free and unlimited access to the online portal after registering on the official website of NPBFX Company.

If you have any questions about trading instruments, you can always ask an analyst in the online chat on the portal and get a free consultation of an experienced specialist.

Use the current recommendations of analysts on USD/JPY and trade efficiently with NPBFX.
 
USD/CHF: USD strengthens 05.09.2018

Good afternoon, dear forum visitors!

NPBFX offers the latest release of analytics on the USD/CHF for a better understanding of the current market situation and more efficient trading.

Current trend

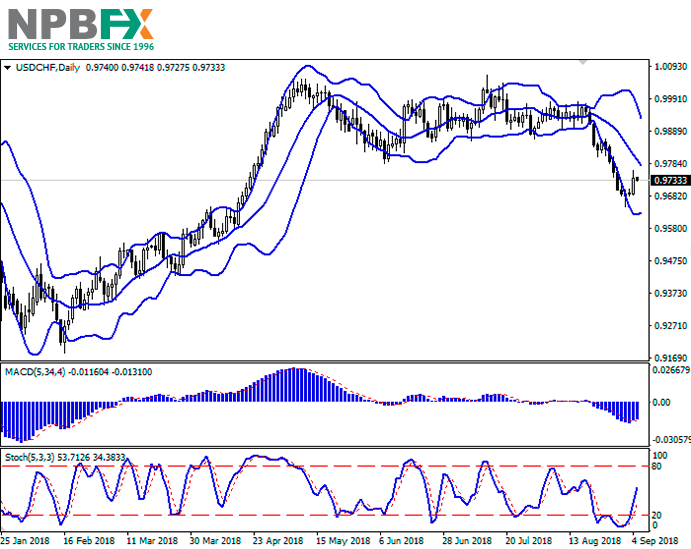
Yesterday, USD rose against CHF, renewing the highs since August 29. CHF is under pressure due to growing trade tensions in EU and the world.

At the end of the week, US President Trump can introduce new increased duties on Chinese goods totaling USD 200 billion. The prospects for the US-Canada negotiations on the new terms of the NAFTA treaty and the US-EU on the car market are still unclear. Some support for EUR is provided by the conciliatory tone of the Italian government. According to La Stampa, Deputy Prime Minister Matteo Salvini supports keeping the deficit of the new Italian budget within 2%, which does not violate the EU budget rules.

Tuesday’s Swiss data did not support CHF. As expected, in August the dynamics of CPI was zero after a decrease of 0.2% MoM in July. The indicators stayed at the level of +1.2% YoY.

Support and resistance

On the daily chart, Bollinger bands are declining. The price range is narrowing, reflecting a change in the trade direction in the short term. MACD reversed upwards, forming a new buy signal (the histogram is above the signal line). Stochastic grows almost vertically, quickly approaching its highs.

It is better to open new long positions ones and keep current ones in the short and super short term.

Resistance levels: 0.9760, 0.9785, 0.9800, 0.9820.

Support levels: 0.9730, 0.9700, 0.9673, 0.9647.

050913.png


050923.png


Trading tips

Long positions can be opened after a rebound from the level of 0.9730 and breakout of the level of 0.9760 with the targets at 0.9800 or 0.9820–0.9840 and stop loss 0.9730–0.9720.

Short positions can be opened after the breakdown of the level of 0.9730 with the target at 0.9673 or 0.9647 and stop loss 0.9760–0.9770.

Implementation period: 2–3 days.

Use more opportunities of the NPBFX analytical portal: economic calendar

Be ready for any market changes through global events using the economic calendar on the NPBFX portal. The calendar contains all the most important events of the world economy and prognoses for them. In order to get free and unlimited access to the economic calendar and other useful instruments on the portal, you need to pass a one-time registration on the NPBFX website.

If you have any questions about trading instruments, you can always ask an analyst in the online chat on the portal and get a free consultation of an experienced specialist.

Use the current recommendations of analysts on USD/CHF and trade efficiently with NPBFX.
 
Last edited:
AUD/USD: wave analysis 07.09.2018

Good afternoon, dear forum visitors!

NPBFX offers the latest release of analytics on the AUD/USD for a better understanding of the current market situation and more efficient trading.

Current trend

The pair can fall.

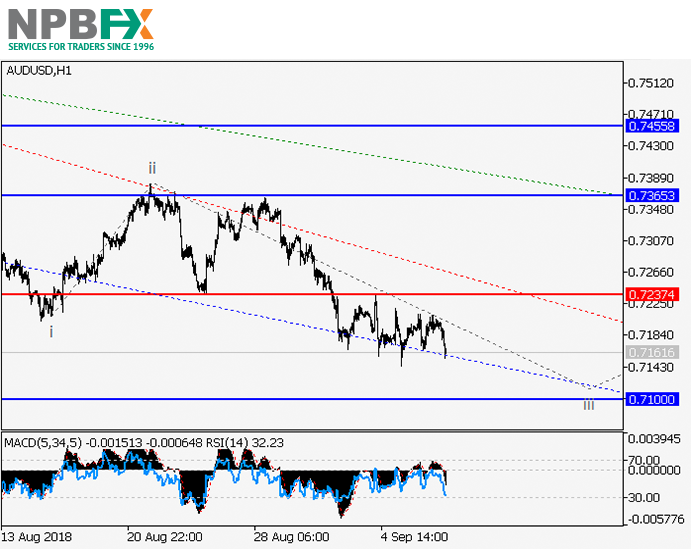
On the 4-hour chart, the third wave of the higher level iii of 1 develops. Now the fifth wave of the lower level (v) of iii is forming, within which the wave iii of (v) is developing. If the assumption is correct, the pair will fall to the levels of 0.7100–0.7000. In this scenario, critical stop loss level is 0.7237.

070913.png


070923.png


Main scenario

Short positions will become relevant during the correction, below the level of 0.7237 with the targets at 0.7100–0.7000. Implementation period: 7 days and more.

Alternative scenario

The breakout and the consolidation of the price above the level of 0.7237 will let the pair grow to the levels of 0.7365–0.7455.

Use more opportunities of the NPBFX analytical portal: e-book

If you just recently started to be interested in trading on FOREX and would like to deepen your knowledge, an electronic Beginner's Guide to FOREX Trading will be an excellent helper for you here. The book consists of 5 chapters and reflects fundamental concepts of the foreign exchange market to start successful trading. From the main chapters of the E-book you can learn about the concepts and history of FOREX, currencies and trend lines, technical indicators, types of orders, trading on news, psychology of trading, risk management and much more.

You can read a Beginner's guide to FOREX Trading online or download it free of charge from the NPBFX analytical portal in the "Education" section. In order to get unlimited access to the E-book and other useful instruments on the portal, you need to register on the NPBFX website.

If you have any questions about trading instruments, you can always ask an analyst in the online chat on the portal and get a free consultation of an experienced specialist.

Use the current recommendations of analysts on AUD/USD and trade efficiently with NPBFX.
 
NZD/USD: the instrument is declining 10.09.2018

Good afternoon, dear forum visitors!

NPBFX offers the latest release of analytics on the NZD/USD for a better understanding of the current market situation and more efficient trading.

Current trend

On Friday, NZD fell against USD, returning to lows of the middle of the previous trading week. Today, the "bearish" dynamics continues to develop, and the NZD/USD pair is renewing its records.

The instrument is under pressure of a strong August US labor market data, published last Friday. Nonfarm Payrolls rose to 201K from 147K in July. The average hourly earnings, which is often mentioned by the Fed in discussing constraints, grew significantly, too. In August, the indicator increased by 2.9% YoY and 0.4% MoM against forecasts of +2.7% YoY and +0.2% MoM.

Support and resistance

On the daily chart, Bollinger bands are steadily declining. The price range is widening from below, letting the "bears" renew the lows. MACD indicator is pointing down, keeping a strong sell signal (the histogram is below the signal line). After the growth at the end of the last trading week, Stochastic is reversing downwards under the pressure of "bearish" trades on Friday and Monday. However, the indicator reflects that NZD is strongly oversold in the short and ultra-short term.

Current indicators’ readings do not contradict the further development of the downward trend in the near future.

Resistance levels: 0.6529, 0.6543, 0.6560, 0.6592, 0.6618.

Support levels: 0.6511, 0.6500, 0.6460.

100913.png


Trading tips

Long positions can be opened after rebound from the level of 0.6511 and breakout of the level of 0.6529 or 0.6543 with the targets at 0.6618–0.6650 and stop loss 0.6511–0.6500. Implementation period: 2–3 days.

Short positions can be opened after the breakdown of the level of 0.6511 with a target at 0.6460 and stop loss 0.6543. Implementation period: 1–2 days.

Use more opportunities of the NPBFX analytical portal: trading signals

Make right trade decisions on sell or buy NZD/USD and other popular instruments using trading signals on the NPBFX portal. All registered users have free access to signals from the top 10 trading indicators (MA10, BBands, Ichimoku, Stochastic, ZigZag, etc.) with also general recommendations on the portal.

If you have any questions about trading instruments, you can always ask an analyst in the online chat on the portal and get a free consultation of an experienced specialist.

Use the current recommendations of analysts on NZD/USD and trade efficiently with NPBFX.
 
Last edited:
USD/JPY: USD is strengthening 12.09.2018

Good afternoon, dear forum visitors!

NPBFX offers the latest release of analytics on the USD/JPY for a better understanding of the current market situation and more efficient trading.

Current trend

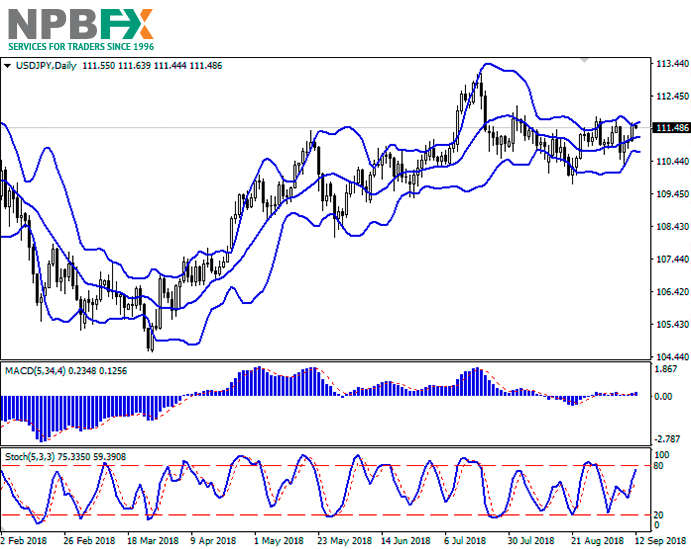
USD increased significantly against JPY on Tuesday, updating weekly highs.

As there is a lack of key economic releases, the movement of JPY is of technical nature. JPY continues to be pressured by risks of a toughening of the US-China trade war, as well as the possibility of the US administration imposing duties on Japanese goods, including cars, if the US trade deficit with Japan does not decline.

Macroeconomic statistics from Japan published on Tuesday did not support JPY. Tertiary Industry Index in August grew by 0.1% MoM after declining by 0.6% MoM in the previous month. Machine Tool Orders in August demonstrated growth by 5.3% YoY after an increase by 13.1% YoY in the previous month.

Support and resistance

In the D1 chart Bollinger Bands demonstrate a slight increase, keeping a tendency to reversal into a horizontal plane. The price range is slightly widening. MACD is growing keeping a weak buy signal (located above the signal line). Stochastic keeps its upward direction but is approaching its maximum levels, which reflects the overbought USD in the ultra-short term.

Technical indicators do not contradict the further development of the "bullish" trend in the short and/or ultra-short term.

Resistance levels: 111.81, 112.13, 112.55.

Support levels: 111.47, 111.16, 110.90, 110.67, 110.45.

11.jpg


22.jpg


Trading tips

To open long positions one can rely on the breakout of 111.81 while maintaining "bullish" signals from technical indicators. Take profit — 112.55. Stop loss — 111.50 or 111.47.

The development of corrective dynamics with the breakdown of 111.47 or 111.30 may become a signal for a full-scale descending correction with target at 110.67 or 110.45. Stop loss — 111.60 or 111.80.

Implementation period: 2-3 days.

Use more opportunities of the NPBFX analytical portal: economic indicators

Regular monitoring of global economic indicators plays an important role in trading, because of their strong influence on FOREX market and possibility to provoke significant price fluctuations. For the convenience of traders the "Education" section on the NPBFX portal contains the most popular and significant world economic indices with a detailed description, their possible impact on the economy and exchange rates (GDP, consumer price index, unemployment rate, Nonfarm Payrolls (NFP), etc.).

If you have any questions about trading instruments, you can always ask an analyst in the online chat on the portal and get a free consultation of an experienced specialist.

Use the current recommendations of analysts on USD/JPY and trade efficiently with NPBFX.
 
XAG/USD: silver prices consolidate

Good afternoon, dear forum visitors!

NPBFX offers the latest release of analytics on the XAG/USD for a better understanding of the current market situation and more efficient trading.

Current trend

Yesterday, silver prices declined, despite that during the day, the instrument updated the local highs since September 4. The positive dynamics was due to a noticeable weakening of the US currency after the publication of poor inflation data. The downward pullback, in turn, was due to the growing traders’ interest in risk.

In August, US Consumer Price Index fell from 2.9% YoY to 2.7% YoY (minimum since April), and the Base Consumer Price Index rose from 2.4% to 2.2% (the worst indicator since May). Market participants feared that poor inflation data, along with pressure from President Trump's administration and trade tensions, could force FOMC members to cut rates of interest rate increase. In particular, this year the regulator can hold another increase instead of the two planned.

Support and resistance

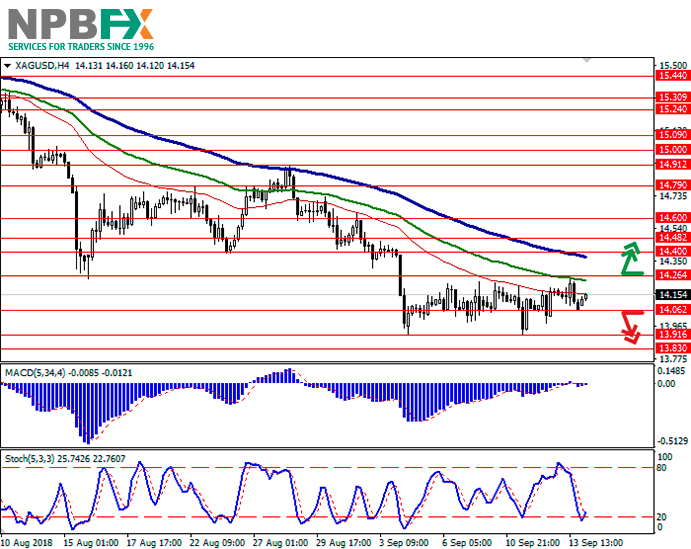
On the daily chart, Bollinger bands are moderately falling. The price range is actively narrowing, reflecting the emergence of mixed dynamics in the short term. MACD indicator is growing, keeping a strong buy signal (the histogram is above the signal line).

Stochastic grows, approaching its highs, which indicate that the instrument is overbought in the ultra-short-term and/or short-term.

It is better to keep current positions and not to open new ones at the end of the week.

Resistance levels: 14.26, 14.40, 14.48, 14.60.

Support levels: 14.06, 13.91, 13.83.

67.jpg


76.jpg


Trading tips

Long positions can be opened after the breakout of the level of 14.26 with the targets at 14.60–14.70 and stop loss 14.15–14.10.

Short positions can be opened after the breakdown of the level of 14.06 with the targets at 13.83–13.70 and stop loss 14.20.

Implementation period: 2–3 days.

Use more opportunities of the NPBFX analytical portal:glossary

Beginning traders certainly face a lot of specialized concepts and lexicon on FOREX, which are often not fully been understood. Swap, tick, hedge, margin calls are often unfamiliar to beginning traders. But the lack of knowledge of these fundamentals make a competent market vision impossible. So glossary on the NPBFX analytical portal could be an excellent helper in this case, which contains all the main definitions with explanations in a compact and accessible form. All concepts are arranged in alphabetical order, so that you can easily and quickly find and explore a new concept for yourself.

If you have any questions about trading instruments, you can always ask an analyst in the online chat on the portal and get a free consultation of an experienced specialist.

Use the current recommendations of analysts on XAG/USD and trade efficiently with NPBFX.
 

Latest Posts

Live Forex Chart

Currency
Rates
EUR / USD
1.13779
USD / JPY
157.199
GBP / USD
1.32465
USD / CHF
0.82892
USD / CAD
1.41408
EUR / JPY
178.913
AUD / USD
0.70211
Back
Top
Log in Register