BTC USD 84,140.3 Gold USD 4,285.46
Time now: Jun 1, 12:00 AM

NPBFX - npbfx.com

XAU/USD: gold remains under pressure 05.03.2018

Good afternoon, dear forum visitors!

NPBFX offers the latest release of analytics on the XAU/USD for a better understanding of the current market situation and more efficient trading.

Current trend

Gold prices continue moderate growth on March 5, developing "bullish" dynamics, the reason for which last week, in addition to technical factors, were the fears of the market regarding the aggravation of trade relations between the US and other countries after Donald Trump announced import tariffs on aluminum and steel.

At the same time, more confident growth of gold price is still hampered by the prospects for an increase in the Fed's interest rate this year, the first of which is projected to take place at the end of March.

Support and resistance

Bollinger Bands in D1 chart demonstrate a gradual decrease. The price range is not changing, while remaining spacious enough given the high activity level in the market. Until the clarification of the situation, the channel trading strategy should be followed.

MACD indicator is growing preserving a weak buy signal (histogram is above the signal line). There is an opportunity to maintain the existing long positions and open new ones in the short and/or ultra-short term.

Stochastic is showing similar dynamics preserving stable upward direction. One should consider buying in the short term.

Resistance levels: 1331.80, 1340.68, 1344.35, 1350.00.

Support levels: 1325.17, 1320.60, 1315.65, 1306.70.

51.jpg


52.jpg


Trading tips

To open long positions, one can rely on the breakout of 1331.80 mark, provided that the showing of technical indicators do not contradict the development of the "bullish" trend. Take-profit – 1340.68 or 1344.35. Stop-loss – 1325.17. Implementation period: 2-3 days.

The rebound from the level of 1325.17 as from resistance, with the subsequent breakdown of 1320.60 mark, can become a signal to the resumption of sales with targets at 1310.00 or 1306.70. Stop-loss should be placed no further than 1330.00. Implementation period: 2-3 days.

Use more opportunities of the NPBFX analytical portal: economic calendar

Be ready for any market changes through global events using the economic calendar on the NPBFX portal. The calendar contains all the most important events of the world economy and prognoses for them. In order to get free and unlimited access to the economic calendar and other useful instruments on the portal, you need to pass a one-time registration on the NPBFX website.

If you have any questions about trading instruments, you can always ask an analyst in the online chat on the portal and get a free consultation of an experienced specialist.

Use the current recommendations of analysts on XAU/USD and trade efficiently with NPBFX.
 
NPBFX Analytical Portal Services for your everyday use

Good afternoon, dear forum visitors!

To make our clients trading more convenient NPBFX organized the most useful and popular trading tools together on the analytical portal. The unique service will be an excellent assistant for traders of all levels every day. NPBFX presents the TOP 5 most requested tools for traders below.

1.png


Top 5 tools on the NPBFX portal for every day

1.Analytics Feed. Get unlimited access to fresh analytics on the online portal. Every day you will find detailed analytical reviews with charts on the most popular trading instruments. This will help you to make correct trading decisions in a current situation on currency (GBP/USD, USD/JPY, EUR/USD, NZD/USD, etc.), commodities (Silver, Gold, Brent, WTI oil), stock indexes (YM, NQ, FDAX, etc.), cryptocurrency (Bitcoin, Ethereum). In case you don’t have enough experience yet, use simple trading recommendations.

2. Trading signals. This service gives specific trading recommendations for each instrument at the moment - whether to buy, sell an asset or wait. One more benefit of trading signals is that you can simply check or make your trading decisions. Signals are available for currency pairs, stock indexes and commodities and are automatically updated every minute. Trading signals on the portal are formed from the top 10 technical indicators such as MA10, MA20, MA50, MA100, MACD, BBands, Ichimoku, Stochastic, William`s, ZigZag.

3. Economic calendar. Keep your finger on the pulse of the Forex market with the latest news in the economic calendar. Don’t miss any important event on the world market and make timely trading decisions. Each event is accompanied by a countdown timer, a priority marker and a brief description of its economic impact.

4. Deal size calculator. Both beginners and experienced traders face the question of choosing optimal lot and risks sizes every time a trade is opened. And if you have 5-10-20 trades a day? HFT-traders make even more trades daily. A good solution here is the deal size calculator to simplify this trading "routine" and save time. You only need to enter the initial data to get a full calculation of deal size.

5. Chat with analyst. You can send any questions about trading instruments directly to an analyst in the online portal chat. In which case it will be useful? If you can’t decide on trading steps, don’t know how to use this or that instrument, want to know trends, etc. So an independent financial team will promptly provide you a detailed answer within one trading day.

To get an access to all useful tools of the analytical portal you need to register on the NPBFX website. You don’t have to immediately make an obligatory deposit to start using all the materials and tools.

Test the TOP 5 tools on the NPBFX portal and start increasing your trading efficiency 5 times today!
 
USD/CHF: wave analysis 07.03.2018

Good afternoon, dear forum visitors!

NPBFX offers the latest release of analytics on the USD/CHF for a better understanding of the current market situation and more efficient trading.

Current trend

The pair can decrease.

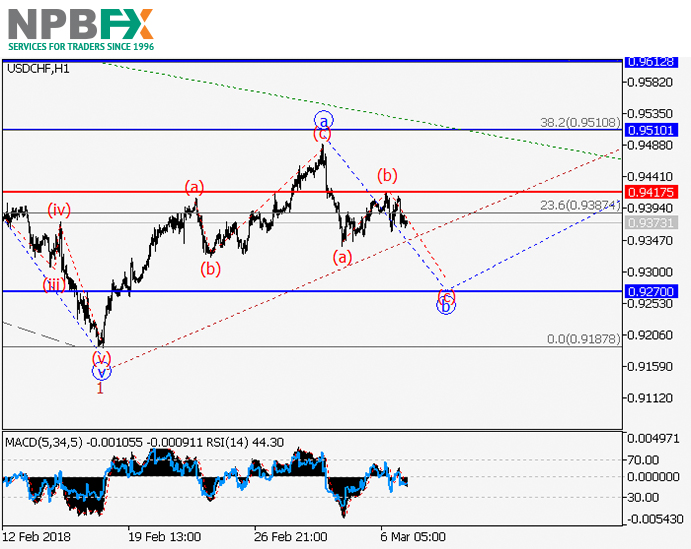
On the 4-hour chart, the upward correction is developing as a wave 2 of (3) of the higher level. Now the wave a of 2 has formed, and the wave b of 2 is developing. If the assumption is correct, the pair will fall to the level of 0.9270. The level of 0.9417 is critical for this scenario.

071.jpg


072.jpg


Main scenario

Short positions will become relevant below the level of 0.9417 with the target at 0.9270.

Alternative scenario

The breakout and the consolidation of the price above the level of 0.9417 will let the pair grow to the levels of 0.9510–0.9612.

Use more opportunities of the NPBFX analytical portal: glossary

Beginning traders certainly face a lot of specialized concepts and lexicon on FOREX, which are often not fully been understood. Swap, tick, hedge, margin calls are often unfamiliar to beginning traders. But the lack of knowledge of these fundamentals make a competent market vision impossible. So glossary on the NPBFX analytical portal could be an excellent helper in this case, which contains all the main definitions with explanations in a compact and accessible form. All concepts are arranged in alphabetical order, so that you can easily and quickly find and explore a new concept for yourself.

If you have any questions about trading instruments, you can always ask an analyst in the online chat on the portal and get a free consultation of an experienced specialist.

Use the current recommendations of analysts on USD/CHF and trade efficiently with NPBFX.
 
USD/CAD: USD remains under pressure 12.03.2018

Good afternoon, dear forum visitors!

NPBFX offers the latest release of analytics on the USD/CAD for a better understanding of the current market situation and more efficient trading.

Current trend

USD showed a steady decline against CAD at the trading on March 9, responding to the publication of an ambiguous report on the US labor market, whose main negative factor was slowing the growth of wages, and a fairly strong report on the Canadian labor market.

The Canadian report reflected a decline in the unemployment rate from 5.9% to 5.8%, which was better than the analysts' expectations, which did not imply any change in the indicator at all. At the same time, the number of employed in February rose by 15.4K after a decrease of 88.0K last month.

Support and resistance

On the D1 chart, the Bollinger Bands are gradually reversing horizontally. The price range is narrowing, but remains quite spacious, given the current activity in the market. Until the clarification of the situation, the channel trading strategy should be followed.

MACD is going down preserving a stable sell signal (histogram is located below the signal line). There is an opportunity to maintain the existing long positions and open new ones in the short term.

Stochastic maintains a confident downward direction, but is located in close proximity to the zero mark, which indicates a high risk of corrective growth, due to the considerable oversold status of the instrument in the short-term prospect of trading.

Resistance levels: 1.2860, 1.2894, 1.2964, 1.3000.

Support levels: 1.2800, 1.2752, 1.2710, 1.2647.

121.jpg


122.jpg


Trading tips

To open long positions, one can rely on the rebound from the support level of 1.2800, provided that the showings of technical indicators do not contradict the development of the correctional trend. Take-profit – 1.2900-1.2920. Stop-loss — 1.2752. Implementation period: 2-3 days.

The breakdown of 1.2800 mark may serve as a signal to further sales with the targets at 1.2710-1.2700. Stop-loss – 1.2850. Implementation period: 2-3 days.

Use more opportunities of the NPBFX analytical portal: analytics

You can find more actual analytical reviews on other popular currency pairs, metals and CFDs on the NPBFX online portal. Daily analytics with charts, current market prognoses and trading scenarios in the Feed section are available. Get free and unlimited access to the online portal after registering on the official website of NPBFX Company.

If you have any questions about trading instruments, you can always ask an analyst in the online chat on the portal and get a free consultation of an experienced specialist.

Use the current recommendations of analysts on USD/CAD and trade efficiently with NPBFX.
 
NZD/USD: general review 14.03.2018

Good afternoon, dear forum visitors!

NPBFX offers the latest release of analytics on the NZD/USD for a better understanding of the current market situation and more efficient trading.

Current trend

The pair NZD/USD continues to grow, despite positive data on the US Consumer Price Index, which were published on Tuesday.

The American currency is under pressure due to the dismissal of Secretary of State Rex Tillerson. It is noteworthy that President Trump announced his dismissal on Twitter, with no official statement in diplomatic circles. In addition, the tension between China and the United States is growing, since the new tariffs levied on Chinese goods are extremely unsuitable for the PRC. If a compromise is not found within the next 2 weeks, then not only the USD, but the entire world economy will suffer.

Today at 14:30 (GMT+2) statistics on retail sales will be published in the US. The growth in sales volume of less than 0.4% will provide significant support to the pair. At 23:45 (GMT+2), Statistics New Zealand will release data on GDP. If the annual GDP growth is 3.1% or more, the pair will be able to gain a foothold above the significant level of 0.7400.

Support and resistance

On H4 chart, the instrument could not gain a foothold above the strong resistance level of 0.7350. Bollinger Bands corrected upwards, the price range slightly decreased, which is the basis for changing downward dynamics. MACD histogram is in the positive zone maintaining the buy signal. Stochastic does not give a clear signal for opening positions.

Support levels: 0.7176, 0.7202, 0.7225, 0.7257, 0.7279, 0.7311.

Resistance levels: 0.7315, 0.7335, 0.7360, 0.7380, 0.7400, 0.7425.

141.jpg


Trading tips

Long positions may be opened above the level of 0.7350 with targets at 0.7385, 0.7400 and stop-loss at 0.7325. Implementation period: 1-2 days.

Short positions may be opened from the level of 0.7305 with target at 0.7255 and stop-loss at 0.7325. Implementation period: 1 day.

Use more opportunities of the NPBFX analytical portal: economic calendar

Be ready for any market changes through global events using the economic calendar on the NPBFX portal. The calendar contains all the most important events of the world economy and prognoses for them. In order to get free and unlimited access to the economic calendar and other useful instruments on the portal, you need to pass a one-time registration on the NPBFX website.

If you have any questions about trading instruments, you can always ask an analyst in the online chat on the portal and get a free consultation of an experienced specialist.

Use the current recommendations of analysts on NZD/USD and trade efficiently with NPBFX.
 
USD/JPY: wave analysis 19.03.2018

Good afternoon, dear forum visitors!

NPBFX offers the latest release of analytics on the USD/JPY for a better understanding of the current market situation and more efficient trading.

Current trend

The pair can grow.

On the 4-hour chart, the downward momentum has formed as a wave C within the correction of the higher level (B). Now the development of the wave (C) has begun, within which the first wave of the lower level (i) of i has formed, and the downward correction (ii) of I has ended. If the assumption is correct, the pair will grow to the levels of 108.65–109.60. The level of 105.40 is critical for this scenario.

191.jpg


192.jpg


Main scenario

Long positions will become relevant during the correction, above the level of 105.40 with the targets at 108.65–109.60.

Alternative scenario

The breakdown and the consolidation of the price below the level of 105.40 will let the pair go down to the levels of 104.50–103.50.

Use more opportunities of the NPBFX analytical portal: trading signals

Make right trade decisions on sell or buy USD/JPY and other popular instruments using trading signals on the NPBFX portal. All registered users have free access to signals from the top 10 trading indicators (MA10, BBands, Ichimoku, Stochastic, ZigZag, etc.) with also general recommendations on the portal.

If you have any questions about trading instruments, you can always ask an analyst in the online chat on the portal and get a free consultation of an experienced specialist.

Use the current recommendations of analysts on USD/JPY and trade efficiently with NPBFX.
 
GBP/USD: wave analysis 21.03.2018

Good afternoon, dear forum visitors!

NPBFX offers the latest release of analytics on the GBP/USD for a better understanding of the current market situation and more efficient trading.

Current trend

The pair can grow.

On the 4-hour chart, the downward correction has developed as a fourth wave iv of 5 within the first wave (1) of the higher level. Locally the first wave of the lower level (i) of v of 5 has formed. If the assumption is correct, after the end of the correction (ii) of v the pair will grow to the levels of 1.4280–1.4350. The level of 1.3850 is critical for this scenario.

211.jpg


212.jpg


Main scenario

Long positions will become relevant during the correction, above the level of 1.3850 with the targets at 1.4280–1.4350.

Alternative scenario

The breakdown and the consolidation of the price below the level of 1.3850 will let the pair go down to the level of 1.3710.

Use more opportunities of the NPBFX analytical portal: economic indicators

Regular monitoring of global economic indicators plays an important role in trading, because of their strong influence on FOREX market and possibility to provoke significant price fluctuations. For the convenience of traders the "Education" section on the NPBFX portal contains the most popular and significant world economic indices with a detailed description, their possible impact on the economy and exchange rates (GDP, consumer price index, unemployment rate, Nonfarm Payrolls (NFP), etc.).

If you have any questions about trading instruments, you can always ask an analyst in the online chat on the portal and get a free consultation of an experienced specialist.

Use the current recommendations of analysts on GBP/USD and trade efficiently with NPBFX.
 
EUR/USD: wave analysis 26.03.2018

Good afternoon, dear forum visitors!

NPBFX offers the latest release of analytics on the EUR/USD for a better understanding of the current market situation and more efficient trading.

Current trend

The pair can grow.

On the 4-hour chart, the upward trend is developing within the first wave (1) of the higher level. Now the fifth wave of the lower level v of 5 of (1), within which the development of the wave (iii) of v has begun, is forming. If the assumption is correct, the pair will grow to the level of 1.2650. The level of 1.2280 is critical for this scenario.

261.jpg


262.jpg


Main scenario

Long positions will become relevant during the correction, above the level of 1.2280 with the target at 1.2650.

Alternative scenario

The breakdown and the consolidation of the price below the level of 1.2280 will let the pair go down to the level of 1.2150.

Use more opportunities of the NPBFX analytical portal: analytics

You can find more actual analytical reviews on other popular currency pairs, metals and CFDs on the NPBFX online portal. Daily analytics with charts, current market prognoses and trading scenarios in the Feed section are available. Get free and unlimited access to the online portal after registering on the official website of NPBFX Company.

If you have any questions about trading instruments, you can always ask an analyst in the online chat on the portal and get a free consultation of an experienced specialist.

Use the current recommendations of analysts on EUR/USD and trade efficiently with NPBFX.
 
AUD/USD: wave analysis 28.03.2018

Good afternoon, dear forum visitors!

NPBFX offers the latest release of analytics on the AUD/USD for a better understanding of the current market situation and more efficient trading.

Current trend

The pair can grow.

On the 4-hour chart, the downward correction has formed as a second wave 2 of (3) of the higher level. Now the development of the wave 3 of (3) has begun, within which the first wave of the lower level i of (i) has formed, and the correction ii of (i) has ended. If the assumption is correct, the pair will grow to the levels of 0.7916–0.8140. The level of 0.7670 is critical for this scenario.

281.jpg


2.jpg


Main scenario

Long positions will become relevant above the level of 0.7670 with the targets at 0.7916–0.8140.

Alternative scenario

The breakdown and the consolidation of the price below the level of 0.7670 will let the pair go down to the level of 0.7537.

Use more opportunities of the NPBFX analytical portal: economic calendar

Be ready for any market changes through global events using the economic calendar on the NPBFX portal. The calendar contains all the most important events of the world economy and prognoses for them. In order to get free and unlimited access to the economic calendar and other useful instruments on the portal, you need to pass a one-time registration on the NPBFX website.

If you have any questions about trading instruments, you can always ask an analyst in the online chat on the portal and get a free consultation of an experienced specialist.

Use the current recommendations of analysts on AUD/USD and trade efficiently with NPBFX.
 
The schedule of service during the Easter holiday at March 30, 2018

Dear Clients!

NPBFX Company notifies about changes in the trading schedule during the Easter holiday at 30.03.2018 (Friday).

FOREX (currency): without changes

XAUUSD, XAGUSD (gold and silver): break in trade

XBRUSD, XTIUSD, XNGUSD (oil Brent and WTI, natural gas): break in trade

Please consider this information when making trading decisions.
 

Latest Posts

Live Forex Chart

Currency
Rates
EUR / USD
1.13910
USD / JPY
157.285
GBP / USD
1.32505
USD / CHF
0.82827
USD / CAD
1.41455
EUR / JPY
179.163
AUD / USD
0.70328
Back
Top
Log in Register