BTC USD 83,843.9 Gold USD 4,285.46
Time now: Jun 1, 12:00 AM

NPBFX - npbfx.com

AUD/USD: general analysis 05.02.2018

Good afternoon, dear forum visitors!

NPBFX offers the latest release of analytics on the AUD/USD for a better understanding of the current market situation and more efficient trading.

Current trend

Having reached a local maximum at the end of January, the pair switched to a decline and is currently trading below the psychological level of 0.8000. On the last trading day of the previous week AUD/USD lost more than 100 points due to the publication of positive labor market statistics in the US. The share of labor as well as the unemployment rate remained unchanged, while the average hourly wage rose by 0.4%, which is better than the forecast by 0.3%. In addition, NFPR in January increased by 200K with a forecast of growth of 180K. At the same time, additional pressure on the instrument was formed as a result of mass profit-taking by market participants who showed reasonable caution before publishing US labor market statistics.

Now the instrument is in the correction phase, before the announcement of the RBA’s decision on the interest rate. The Australian regulator is not interested in strengthening the AUD and it is very likely that the pair will continue to fall to the levels of 0.7855, 0.7820 in the next two days.

Support and resistance

On the 4-hour chart Bollinger bands are directed downward; the price range has expanded, which indicates a further fall.

The MACD histogram reached a minimum value in the negative zone, holding a strong sell signal.

Stochastic Oscillator leaves the oversold area, forming a strong buy signal.

Support levels: 0.7731, 0.7769, 0.7820, 0.7856, 0.7903.

Resistance levels: 0.7966, 0.8015, 0.8075, 0.8124.

0502.jpg


Trading tips

Short positions should be opened below the level of 0.7900 with targets of 0.7820, 0.7800 and stop loss at 0.7945. Term of realization: 2 days.

Long positions can be placed above the level 0.8020 with targets of 0.8085, 0.8125 and stop loss at 0.7975. Term of realization: 2-3 days.

Use more opportunities of the NPBFX analytical portal: economic calendar

Be ready for any market changes through global events using the economic calendar on the NPBFX portal. The calendar contains all the most important events of the world economy and prognoses for them. In order to get free and unlimited access to the economic calendar and other useful instruments on the portal, you need to pass a one-time registration on the NPBFX website.

If you have any questions about trading instruments, you can always ask an analyst in the online chat on the portal and get a free consultation of an experienced specialist.

Use the current recommendations of analysts on AUD/USD and trade efficiently with NPBFX.
 
Cashback - get up to 60% of spread from each trade in NPBFX!

1-5.jpg


Make your trading with NPBFX broker even more profitable! Take part in the Cashback program and get up to 60% of spread from each trading transaction. Both new and existing clients have such an opportunity to earn more with NPBFX. The amount of monthly cashback payment can reach $ 10,000 which is credited directly to your trading account.

You can withdraw cashback or continue trading with no restrictions.

Terms and conditions of Cashback

Cashback is available on Master trading accounts only. Deposit funds to your trading account from 100 US dollars/100 euro/5000 rubles to get an access to the service.

Cashback is credited for each closed transaction with a minimum trade volume of 0,01 lots. You can use any trading strategy or Expert advisor in your trading. To start receiving cashback for you trading you need to register your trading account in the promotion.

Get up to $ 7 per lot

Monthly cashback is credited to a trading account within 10 days of the next calendar month. You can get up to $ 7 per closed lot which is calculated by a transparent scheme.

How to connect Cashback to your NPBFX trading account

Send an email to [email protected] indicating your trading account number. New clients need to register first and open new Master trading account with a minimum deposit of $ 100.

Hurry up to take part in the promotion! It is running until February 28, 2018. Earn more by receiving cashback for each trade with NPBFX!
 
XAU/USD: gold prices are going down 07.02.2018

Good afternoon, dear forum visitors!

NPBFX offers the latest release of analytics on the XAU/USD for a better understanding of the current market situation and more efficient trading.

Current trend

Gold fell in price yesterday, marking a new local minimum since January 11.

The reason was a strong dollar, which managed to secure support in the market despite a number of pessimistic macroeconomic publications from the US. Also, the strengthening of the US currency was promoted by mass sales on the stock market.

Today, the instrument shows a slight increase, which may be a corrective pullback. However, moderate support for gold was provided by the statements of Saint Louis FRB President James Bullard, who said that now there is no need in another increase of the interest rate without clear signals about accelerating economic growth.

Support and resistance

Bollinger Bands in D1 chart demonstrate flat dynamics. The price range is practically unchanged, but it remains rather spacious given the trade dynamics in the market. The channel trading strategy should be followed.

MACD is going down preserving a stable sell signal (being located under the signal line). There is an opportunity to maintain the existing short positions in the short term, whereas to open new transactions it is better to wait for the appearance of additional signals.

Stochastic reached the mark of 20 and is currently trying to turn to growth. It is necessary to wait for clarification of the situation.

Resistance levels: 1334.08, 1344.35, 1350.00, 1357.15.

Support levels: 1327.03, 1319.85, 1315.65, 1305.52.

0711.jpg


0722.jpg


Trading tips

To open long positions, one can rely on the breakout of 1334.08 mark, if the showings of technical indicators do not contradict the "bullish" dynamics. Take-profit — 1344.35 or 1350.00. Stop-loss – 1327.03. Implementation time: 2-3 days.

The return of "bearish" dynamics with the breakdown of the level of 1319.85 may become a signal for further sales with the target at 1305.52. Stop-loss – 1327.03. Implementation time: 2-3 days.

Use more opportunities of the NPBFX analytical portal: glossary

Beginning traders certainly face a lot of specialized concepts and lexicon on FOREX, which are often not fully been understood. Swap, tick, hedge, margin calls are often unfamiliar to beginning traders. But the lack of knowledge of these fundamentals make a competent market vision impossible. So glossary on the NPBFX analytical portal could be an excellent helper in this case, which contains all the main definitions with explanations in a compact and accessible form. All concepts are arranged in alphabetical order, so that you can easily and quickly find and explore a new concept for yourself.

If you have any questions about trading instruments, you can always ask an analyst in the online chat on the portal and get a free consultation of an experienced specialist.

Use the current recommendations of analysts on XAU/USD and trade efficiently with NPBFX.
 
Currencies + Commodities or how to diversify your trading portfolio

Good afternoon, dear forum visitors!

2.jpg


Forex trading is not limited only by trading currencies. You can also try favorable terms on commodity trading with NPBFX including Gold, Silver, Crude Oil.

Low spreads on commodities in NPBFX

Spread is a particularly important thing in trading commodities. And it’s normal for the market commodities spreads to be higher than in currency trading. But this fact doesn’t make trading commodities non profitable, especially with really low spreads in NPBFX. You can check it right now in the table below.

1-1.jpg


NPBFX works exclusively using the STP business model with routing all trading orders directly to the market. This helps to provide the best market prices for our traders. Tight spreads on STP trading accounts in NPBFX allow you to save trading costs and get more profit. Add here fast execution that makes trading in NPBFX triple-comfortable and profitable.

Diversify risks

Trading only currencies can give an excellent income, but why do many traders want to diversify their trading portfolios? What is the reason for a trader to try new trading instruments? One of the most significant reasons is the risks diversification.

Just take a look at a simple example: You have open trades on EUR/USD, USD/JPY, Gold, Silver and Oil or you trade only one or two instruments. So you will have much more probability not to lose the whole deposit and get profit in the first case than in the second one.

However, professional traders do not recommend beginners to immediately include a large share of commodities in their trading portfolios. You can start with 1% of each new commodity instrument and gradually increase its amount to minimize risks.

Feel free to use the analytical reviews, trading signals and recommendations on commodities from the NPBFX analytical portal. These useful materials will help you to get better understanding of trading instruments and to become more confident in your trading decisions. Full access to the portal is available to all registered users.

Widen your trading portfolio with commodities and earn even more on favorable terms with NPBFX!
 
USD/CHF: the pair is trading mixed 12.02.2018

Good afternoon, dear forum visitors!

NPBFX offers the latest release of analytics on the USD/CHF for a better understanding of the current market situation and more efficient trading.

Current trend

On Friday, USD grew against CHF, partially restoring Thursday’s fall, when the pair rapidly stepped off from renewed local highs. The instrument was supported mainly by technical factors, as there was lack of key macroeconomic releases in the end of the last week.

Today the instrument is tending to the “bearish” dynamics again, and investors are waiting for new drivers in the market to appear. The traders are focused on January Swiss Consumer Price Index at 10:00 (GMT+2) and US Monthly Budget Statement at 21:00 (GMT+2).

Support and resistance

On the daily chart, Bollinger Bands is reversing horizontally. The price range is actively narrowing, reflecting the mixed dynamics appearance in the recent period and attempt of correctional growth formation in the middle term. It is better to use channel trading strategy until the situation is clear.

MACD is growing, keeping moderate buy signal (the histogram is above the signal line). It is possible to keep current long positions, while it is better not to open new positions before additional signals appear.

Stochastic has reversed downwards, reacting to the strong Thursday’s decrease. Current readings of the indicator do not contradict with the further development of the downward trend in the short or very short term.

Resistance levels: 0.9395, 0.9424, 0.9467, 0.9531.

Support levels: 0.9346, 0.9286, 0.9243.

121.jpg


122.jpg


Trading tips

Long positions can be opened after the breakout of the levels of 0.9424 or 0.9467 with the targets at 0.9531 or 0.9570–0.9600 and stop loss at 0.9400 or 0.9370. Implementation period: 2–3 days.

Short positions can be opened after the breakdown of the level 0.9346 with the target at 0.9243 or 0.9200 and stop loss at 0.9400. Implementation period: 2–3 days.

Use more opportunities of the NPBFX analytical portal: analytics

You can find more actual analytical reviews on other popular currency pairs, metals and CFDs on the NPBFX online portal. Daily analytics with charts, current market prognoses and trading scenarios in the Feed section are available. Get free and unlimited access to the online portal after registering on the official website of NPBFX Company.

If you have any questions about trading instruments, you can always ask an analyst in the online chat on the portal and get a free consultation of an experienced specialist.

Use the current recommendations of analysts on USD/CHF and trade efficiently with NPBFX.
 
USD/JPY: dollar is going down 14.02.2018

Good afternoon, dear forum visitors!

NPBFX offers the latest release of analytics on the USD/JPY for a better understanding of the current market situation and more efficient trading.

Current trend

Yesterday US currency decreased against Japanese yen. Today it is falling and renewing the lows since the middle of November 2016 due to a large restoration of the stock market, significantly weakened last week. In addition, the investors are skeptical of the interest rate growth this year. However, the increase is expected in March. In addition, USD is under pressure of US CPI release, due at 15:30 (GMT+2), which is expected to be negative.

On the other hand, macroeconomic releases do not support Japanese yen. Wednesday’s Q4 2017 GDP release in Japan reflected the growth by 0.5% YoY, which was almost twice worse than analyst expected. In the Q3 GDP grew by +2.2% YoY.

Support and resistance

On the daily chart, Bollinger Bands are strongly decreasing. The price range is actively widening, but not as fast as the “bearish” trend is developing, which reflects the possibility of correctional; growth appearance of significant slowing of the downward trend development.

MACD is going down, keeping a quite steady sell signal (the histogram is below the signal line). It is possible to keep current short positions but not to open new ones.

Stochastic is going down, but us reaching its lows, which restricts the “bearish” trend development in the short and very short term.

Resistance levels: 107.39, 107.99, 108.26, 108.83.

Support levels: 106.79, 106.02, 105.52.

141.jpg


142.jpg


Trading tips

Long positions can be opened after the rebound at the level of 106.79 and the breakout of the level 107.39 with the targets at 108.83 or 109.11 and stop loss at 106.79–106.60. Implementation period: 2–3 days.

Short positions can be opened after the breakout of the level 106.79 with the targets at 105.52 or 105.00 and stop loss at 107.40. Implementation period: 2–3 days.

Use more opportunities of the NPBFX analytical portal: e-book

If you just recently started to be interested in trading on FOREX and would like to deepen your knowledge, an electronic Beginner's Guide to FOREX Trading will be an excellent helper for you here. The book consists of 5 chapters and reflects fundamental concepts of the foreign exchange market to start successful trading. From the main chapters of the E-book you can learn about the concepts and history of FOREX, currencies and trend lines, technical indicators, types of orders, trading on news, psychology of trading, risk management and much more.

You can read a Beginner's guide to FOREX Trading online or download it free of charge from the NPBFX analytical portal in the "Education" section. In order to get unlimited access to the E-book and other useful instruments on the portal, you need to register on the NPBFX website.

If you have any questions about trading instruments, you can always ask an analyst in the online chat on the portal and get a free consultation of an experienced specialist.

Use the current recommendations of analysts on USD/JPY and trade efficiently with NPBFX.
 
XAU/USD: gold price is consolidating 19.02.2018

Good afternoon, dear forum visitors!

NPBFX offers the latest release of analytics on the XAU/USD for a better understanding of the current market situation and more efficient trading.

Current trend

On Friday, gold prices stepped off the local highs due to the correctional moods favorable for USD after US positive macroeconomic building sector and consumer confidence data, which has significantly exceeded the experts’ expectations. The moon calendar New Year celebrations contributed to the decrease of demand for gold.

The instrument is under pressure due to the expectations of the further Fed’s monetary policy tightening. In March, the planned interest rate rise by 25 basis points is expected. Gold as an asset, which does not generate an interest income, is very sensitive to any changes in the interest rate in the market.

Support and resistance

On the daily chart, Bollinger Bands reversed horizontally. The price range is widening from above, letting the instrument to reach new local highs. It is better to use channel trading strategy until the situation is clear.

MACD is growing, keeping moderate buy signal (the histogram is above the signal line). It is possible to keep current long positions in the short term but not to open new ones.

Stochastic has reversed downwards, reacting to the “bearish” dynamics appearance on Friday. It is possible to open new short positions in the short or very short term.

Resistance levels: 1350.00, 1357.15, 1365.68.

Support levels: 1344.35, 1334.08, 1327.03, 1319.85.

191.jpg


192.jpg


Trading tips

Long positions can be opened after the breakout of the level 1357.15 with the targets at 1365.68 or 1370.00 and stop loss 1350.00. Implementation period: 2–3 days.

Short positions can be opened after the breakout of the level 1344.35 with the target at 1334.08 and stop loss 1350.00. Implementation period: 2 days.

Use more opportunities of the NPBFX analytical portal: economic calendar

Be ready for any market changes through global events using the economic calendar on the NPBFX portal. The calendar contains all the most important events of the world economy and prognoses for them. In order to get free and unlimited access to the economic calendar and other useful instruments on the portal, you need to pass a one-time registration on the NPBFX website.

If you have any questions about trading instruments, you can always ask an analyst in the online chat on the portal and get a free consultation of an experienced specialist.

Use the current recommendations of analysts on XAU/USD and trade efficiently with NPBFX.
 
NZD/USD: New Zealand dollar declines 21.02.2018

Good afternoon, dear forum visitors!

NPBFX offers the latest release of analytics on the NZD/USD for a better understanding of the current market situation and more efficient trading.

Current trend

NZD develops a downward trend against USD, updating local minima since February 13. Correctional sentiments put pressure on the instrument, as well as the widespread growth of the American currency against the background of rising US yields.

The focus of investors' attention today will be macroeconomic statistics from the US, the speech of a member of the Federal Open Market Committee Patrick Harker (16:00 GMT+2), as well as the publication of the minutes of the last meeting of the Fed.

Support and resistance

Bollinger Bands in D1 chart demonstrate flat dynamics. The price range does not change, but still remains quite spacious, given the relatively low level of trading activity during the current week. The channel trading strategy should be followed as before.

MACD is going down preserving a moderate sell signal (histogram is located below the signal line). There is an opportunity to keep and open new short positions in the short and/or ultra-short term.

Stochastic also maintains a confident downward trend, being approximately in the center of its area. Current indicators show an adequate potential for the development of a short-term and an ultra-short-term downtrend.

Resistance levels: 0.7349, 0.7373, 0.7404, 0.7435.

Support levels: 0.7324, 0.7300, 0.7275, 0.7255.

211.jpg


212.jpg


Trading tips

To open long positions, one can rely on the rebound from the support level of 0.7324, with the subsequent breakout of the 0.7349 mark. In this case, corrective buys with the target at 0.7404 should be considered. Stop-loss should be placed no further than 0.7300. Implementation period: 2-3 days.

Confident breakdown of current support levels may indicate further sales. The breakdown of the level of 0.7300 down would provide the way for "the bears" to the levels of 0.7250-0.7230. Stop-loss – 0.7335. Implementation period: 2-3 days.

Use more opportunities of the NPBFX analytical portal: glossary

Beginning traders certainly face a lot of specialized concepts and lexicon on FOREX, which are often not fully been understood. Swap, tick, hedge, margin calls are often unfamiliar to beginning traders. But the lack of knowledge of these fundamentals make a competent market vision impossible. So glossary on the NPBFX analytical portal could be an excellent helper in this case, which contains all the main definitions with explanations in a compact and accessible form. All concepts are arranged in alphabetical order, so that you can easily and quickly find and explore a new concept for yourself.

If you have any questions about trading instruments, you can always ask an analyst in the online chat on the portal and get a free consultation of an experienced specialist.

Use the current recommendations of analysts on NZD/USD and trade efficiently with NPBFX.
 
USD/JPY: wave analysis 26.02.2018

Good afternoon, dear forum visitors!

NPBFX offers the latest release of analytics on the USD/JPY for a better understanding of the current market situation and more efficient trading.

Current trend

The pair can grow.

On the 4-hour chart, the downward momentum has formed as a wave C within the correction of the higher level (B). At the moment the first entering wave of the lower level (i) of I has formed, and the local correction (ii) is ending. If the assumption is correct, the pair will grow to the levels of 110.45–111.30. The level of 105.50 is critical for this scenario.

261.jpg


262.jpg


Main scenario

Long positions will become relevant during the correction, above the level of 105.50 with the targets at 110.45–111.30.

Alternative scenario

The breakdown and the consolidation of the price below the level of 105.50 will let the pair go down to the level of 103.50.

Use more opportunities of the NPBFX analytical portal: e-book

If you just recently started to be interested in trading on FOREX and would like to deepen your knowledge, an electronic Beginner's Guide to FOREX Trading will be an excellent helper for you here. The book consists of 5 chapters and reflects fundamental concepts of the foreign exchange market to start successful trading. From the main chapters of the E-book you can learn about the concepts and history of FOREX, currencies and trend lines, technical indicators, types of orders, trading on news, psychology of trading, risk management and much more.

You can read a Beginner's guide to FOREX Trading online or download it free of charge from the NPBFX analytical portal in the "Education" section. In order to get unlimited access to the E-book and other useful instruments on the portal, you need to register on the NPBFX website.

If you have any questions about trading instruments, you can always ask an analyst in the online chat on the portal and get a free consultation of an experienced specialist.

Use the current recommendations of analysts on USD/JPY and trade efficiently with NPBFX.
 
XAG/USD: prices are falling 28.02.2018

Good afternoon, dear forum visitors!

NPBFX offers the latest release of analytics on the XAG/USD for a better understanding of the current market situation and more efficient trading.

Current trend

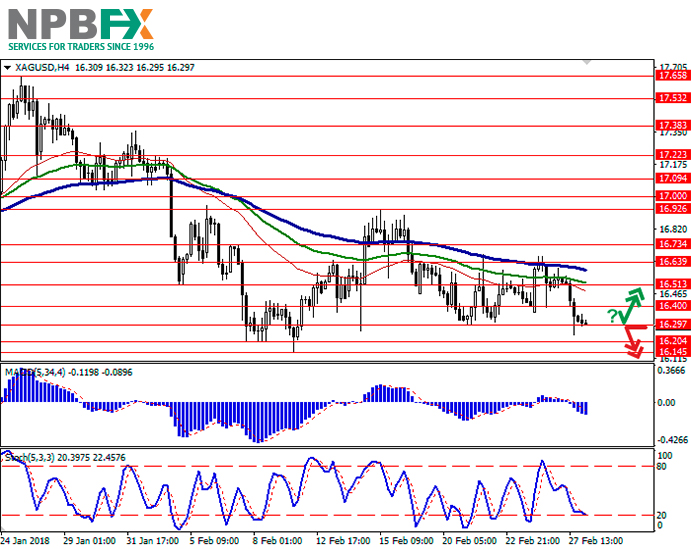
Yesterday silver prices significantly went down and renewed the minimum since February due to the growth of USD. US currency strengthened after the optimistic speech of new Fed’s head Jerome Powell, who promised to keep the current policy of moderate interest rate growth. In addition, he appreciated the US economy perspectives, noting the rapid restoration of a number of indicators.

January data of the growth of demand on gold and silver in China prevented the prices from further decrease. In addition, the traders are waiting for US Gross Domestic Product Annualized release today at 15:30 (GMT+2).

Support and resistance

On the daily chart, Bollinger Bands are moving flat. The price range is the same, reflecting the mixed character of the trading session of the recent weeks. It is better to use channel trading strategy until the situation is clear.

MACD is going down; keeping a weak sell signal (the histogram is below the signal line). It is possible to keep current short positions, but not to open new ones until additional signals appear.

Stochastic does not contradict the MACD signals, keeping the possibility of the “bearish” dynamics development in the short or very short term.

Resistance levels: 16.40, 16.51, 16.63, 16.73.

Support levels: 16.29, 16.20, 16.14.

281.jpg


81.jpg


Trading tips

Long positions can be opened after the rebound at the level of 16.29 and the breakout of the level 16.40 with the targets at 16.63–16.73 and stop loss at 16.15. Implementation period: 2–3 days.

Short positions can be opened after the breakout of the level 16.29 with the targets at 16.14–16.00 and stop loss at 16.40. Implementation period: 2 days.

Use more opportunities of the NPBFX analytical portal: trading signals for commodities

How can a trader determine if it’s worth buying or selling Silver now or better waiting for a more favorable period? Use trading signals for commodities from the top 10 technical indicators on the NPBFX portal and make the right decisions! All registered users have free and unlimited access to the minutely updated trading signals (MA10, BBands, Ichimoku, Stochastic, ZigZag, etc.) for Gold, Silver, Brent and WTI Crude oil.

If you have any questions about trading instruments, you can always ask an analyst in the online chat on the portal and get a free consultation of an experienced specialist.

Use the current recommendations of analysts on XAG/USD and trade efficiently with NPBFX.
 

Latest Posts

Live Forex Chart

Currency
Rates
EUR / USD
1.13916
USD / JPY
157.295
GBP / USD
1.32510
USD / CHF
0.82830
USD / CAD
1.41455
EUR / JPY
179.184
AUD / USD
0.70328
Back
Top
Log in Register