BTC USD 83,305.4 Gold USD 4,193.03
Time now: Jun 1, 12:00 AM

NPBFX - npbfx.com

Who won from $100 to $1000 in December contest? NPBFX presents the results of the last Battle of traders in 2018

Good afternoon, dear forum users!

Recently the year 2018 ended as well as the December Battle of Traders from NPBFX! How many participants took part in it? Who opened the list of TOP 10 winners? Was the iPhone Xs 64Gb presented? Below we will uncover the results and answer the most exciting questions.

The December battle united 1477 traders! Almost every participant of the New Year's Eve contest felt the spirit of rivalry and the desire to win. Daily monitoring reflected strong fight for places in the TOP 10 for the total prize fund of $ 2500.

The contest is held on NPBFX demo accounts and participants are allowed to use any trading strategy and all available instruments (Forex currency, precious metals, cryptocurrency).

Each trader started with a virtual starting deposit of $ 5000. Participants who managed to maximize their initial deposit became the winners. So the December list of winners included the following traders:

123456.png


The honorable first place goes to the trader with a nickname GAS (101295 contest trading account). The trader managed to increase the initial funds by 20 times - up to $ 104388.58! Unfortunately, the amount on the balance was not enough to get a special prize iPhone Xs 64Gb, according to the conditions of the contest. At the same time, the trading result of the December leader can be definitely called excellent!

NPBFX sincerely congratulates all the winners of December contest and also thanks all the participants of the final battle in 2018!

NPBFX invites experienced and beginner traders to participate in the exciting Battle of Traders on demo accounts in February. The registration is opened until February 14, 2019.

You can find the December contest monitoring on the NPBFX website.
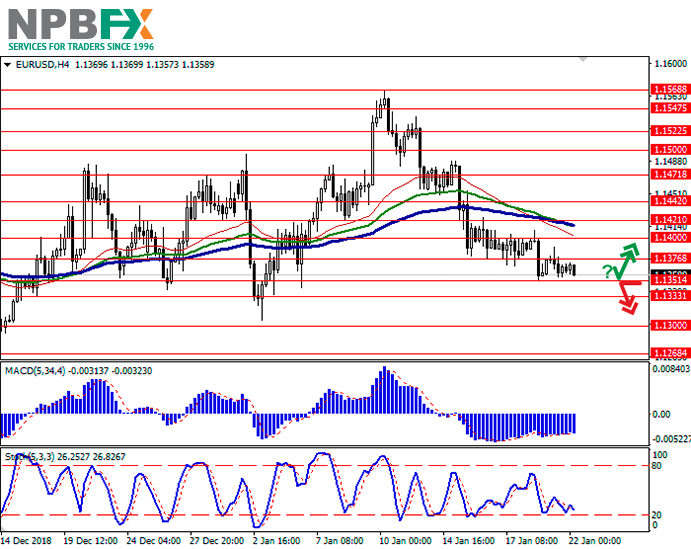
 
EUR/USD: euro remains under pressure 22.01.2019

Good afternoon, dear forum visitors!

NPBFX offers the latest release of analytics on EUR/USD for a better understanding of the current market situation and more efficient trading.

Current trend

Yesterday, EUR rose uncertainly against USD within the correction after last week’s fall. However, the pair failed to consolidate in the new positions and by the end of the session, lost its advantage.

EUR growth is constrained by negative PRC data. Chinese Q4 2018 GDP declined. The indicator fell from 1.6% QoQ to 1.5% QoQ and from 6.5% YoY to 6.4% YoY (the worst figure since 1990). Also, European investors are monitoring the situation around Brexit. Yesterday, Prime Minister Theresa May announced a backup plan for an agreement with the EU.

Today, January German and EU data on the index of business sentiment from ZEW will be published. According to the forecast, the number of pessimists in German business circles will increase: the figure will grow from –17.5 to –18.4. EU figure will decrease from –21.0 to –20.1 but pessimism will continue to prevail in European business circles, which may adversely affect EUR.

Support and resistance

On the daily chart, Bollinger bands move flat. The price range is virtually unchanged but remains wide enough for the current activity level. MACD falls, keeping a strong sell signal (the histogram is below the signal line). Stochastic reached its lows, reversed horizontally, indicating the growing risks of an upward correction in the super short term.

It is better to wait until the situation is clear.

Resistance levels: 1.1376, 1.1400, 1.1421, 1.1442.

Support Levels: 1.1351, 1.1333, 1.1300, 1.1268.

3-3.jpg


4-3.jpg


Trading tips

Long positions can be opened after a rebound from 1.1351 and a breakout of 1.1376 with the targets at 1.1421–1.1442. Stop loss is 1.1351. Implementation period: 2–3 days.

Short positions can be opened after the breakdown of 1.1351 with the target at 1.1300. Stop loss is 1.1376–1.1380. Implementation period: 1–2 days.

Use more opportunities of the NPBFX analytical portal: economic calendar.

Be ready for any market changes through global events using the economic calendar on the NPBFX portal. The calendar contains all the most important events of the world economy and prognoses for them. In order to get free and unlimited access to the economic calendar and other useful instruments on the portal, you need to pass a one-time registration on the NPBFX website.

If you have any questions about trading instruments, you can always ask an analyst in the online chat on the portal and get a free consultation of an experienced specialist.

Use the current recommendations of analysts on EUR/USD and trade efficiently with NPBFX.
 
USD/CHF: wave analysis 22.01.2019

Good afternoon, dear forum visitors!

NPBFX offers the latest release of analytics on USD/CHF for a better understanding of the current market situation and more efficient trading.

The pair may grow.

On the 4-hour chart, a downward correction of the higher level developed as the wave (2), within which the wave C of (2) formed. Now the development of the third wave (3) has begun, within which the first wave of the lower level i of 1 of (3) is forming. If the assumption is correct, the pair will grow to the levels of 1.0126–1.0256. In this scenario, critical stop loss level is 0.9914.

7-1.jpg


8-1.jpg


Main scenario

Long positions will become relevant during the correction, above the level of 0.9914 with the targets at 1.0126–1.0256. Implementation period: 7 days and more.

Alternative scenario

The breakdown and the consolidation of the price below the level of 0.9914 will let the pair go down to the levels of 0.9801–0.9712.

Use more opportunities of the NPBFX analytical portal: analytics.

You can find more actual analytical reviews on other popular currency pairs, metals and CFDs on the NPBFX online portal. Daily analytics with charts, current market prognoses and trading scenarios in the Feed section are available. Get free and unlimited access to the online portal after registering on the official website of NPBFX Company.

If you have any questions about trading instruments, you can always ask an analyst in the online chat on the portal and get a free consultation of an experienced specialist.

Use the current recommendations of analysts on USD/CHF and trade efficiently with NPBFX.
 
USD/CHF: wave analysis 23.01.2019

Good afternoon, dear forum visitors!

NPBFX offers the latest release of analytics on USD/CHF for a better understanding of the current market situation and more efficient trading.

The pair may grow.

On the 4-hour chart, a downward correction of the higher level developed as the wave (2), within which the wave C of (2) formed. Now the development of the third wave (3) has begun, within which the first wave of the lower level i of 1 of (3) is forming. If the assumption is correct, the pair will grow to the levels of 1.0126–1.0256. In this scenario, critical stop loss level is 0.9914.

7-1.jpg


8-1.jpg


Main scenario

Long positions will become relevant during the correction, above the level of 0.9914 with the targets at 1.0126–1.0256. Implementation period: 7 days and more.

Alternative scenario

The breakdown and the consolidation of the price below the level of 0.9914 will let the pair go down to the levels of 0.9801–0.9712.

Use more opportunities of the NPBFX analytical portal: analytics.

You can find more actual analytical reviews on other popular currency pairs, metals and CFDs on the NPBFX online portal. Daily analytics with charts, current market prognoses and trading scenarios in the Feed section are available. Get free and unlimited access to the online portal after registering on the official website of NPBFX Company.

If you have any questions about trading instruments, you can always ask an analyst in the online chat on the portal and get a free consultation of an experienced specialist.

Use the current recommendations of analysts on USD/CHF and trade efficiently with NPBFX.
 
AUD/USD: Australian dollar is going down 25.01.2019

Good afternoon, dear forum visitors!

NPBFX offers the latest release of analytics on AUD/USD for a better understanding of the current market situation and more efficient trading.

Current trend

AUD showed a noticeable decline against USD on Thursday, having updated local lows of January 4. At the same time, in the morning the instrument was trading higher, which was due to the publication of a strong report on the Australian labor market for December.

The unemployment rate dropped to 5.0%, and the employment rate rose by 21.6K. However, general employment growth was achieved due to an increase in the number of part-time working citizens (24.6K). At the same time, the number of full-time workers fell for the second month in a row, this time by 3K. Thus, the state of the labor market in Australia can't be called stable.

Today, the instrument is trading with a raise. Due to the half-empty macroeconomic calendar, investors can concentrate on fixing short profits on AUD.

Support and resistance

Bollinger Bands in D1 chart demonstrate flat dynamics. The price range is expanding, but it still fails to catch the development of the current “bearish” trend, which indicates the risks of corrective growth. MACD is going down keeping a fairly stable sell signal (located below the signal line). Stochastic, having reached its lows, is trying to reverse upwards, indicating an oversold instrument in the ultra-short term.

It is necessary to wait until the upward correction signals are confirmed in the near future.

Resistance levels: 0.7115, 0.7145, 0.7165, 0.7200.

Support levels: 0.7075, 0.7053, 0.7027, 0.7000.

13-1.jpg


14-1.jpg


Trading tips

To open long positions, one can rely on the rebound from 0.7075 as from support with the subsequent breakout of 0.7115. Take profit — 0.7165 or 0.7200. Stop loss — 0.7080.

A breakdown of 0.7075 may be a signal to further sales with target at 0.7000 or 0.6973. Stop loss — 0.7100 or 0.7115.

Implementation period: 2-3 days.

Use more opportunities of the NPBFX analytical portal: glossary

Beginning traders certainly face a lot of specialized concepts and lexicon on FOREX, which are often not fully been understood. Swap, tick, hedge, margin calls are often unfamiliar to beginning traders. But the lack of knowledge of these fundamentals make a competent market vision impossible. So glossary on the NPBFX analytical portal could be an excellent helper in this case, which contains all the main definitions with explanations in a compact and accessible form. All concepts are arranged in alphabetical order, so that you can easily and quickly find and explore a new concept for yourself.

If you have any questions about trading instruments, you can always ask an analyst in the online chat on the portal and get a free consultation of an experienced specialist.

Use the current recommendations of analysts on AUD/USD and trade efficiently with NPBFX.
 
EUR/USD: euro is in the correction 28.01.2019

Good afternoon, dear forum visitors!

NPBFX offers the latest release of analytics on EUR/USD for a better understanding of the current market situation and more efficient trading.

Current trend

On Friday, EUR rose steadily against USD, being corrected upwards after a decline the day before, when it renewed local lows since December 14.

EUR decrease is due to the comments of the ECB Head Mario Draghi. During the press conference following the meeting of the regulator, he noted that the risks for the growth of the European economy were negative due to geopolitical factors and the threat of protectionism. However, the possibility of a recession in the Eurozone is low.

During today’s Asian session, the instrument is developing the “bullish” dynamics. Investors are focused on US housing price indices and Retail Sales. In addition, on Monday, the results of the next Brexit vote will be announced. Failures around the deal may affect EUR negatively.

Support and resistance

On the daily chart, Bollinger bands moderately reduced. The price range is actively narrowing, reflecting the ambiguous recent trading nature. MACD grows, keeping a poor buy signal (the histogram is above the signal line), and is preparing to test the zero line. Stochastic is also directed upwards but approaches its highs, which indicates that EUR can become overbought in the super short term.

It is better to keep current long positions until the situation is clear.

Resistance levels: 1.1424, 1.1450, 1.1471, 1.1500.

Support levels: 1.1400, 1.1376, 1.1351, 1.1335.

44-1.jpg


55-2.jpg


Trading tips

Long positions can be opened after the breakout of 1.1424 with the target at 1.1471 or 1.1500. Stop loss is 1.1400 or 1.1380.

Short positions can be opened after the rebound from 1.1424 and the breakdown of 1.1400 with the targets at 1.1351–1.1335. Stop loss is 1.1424–1.1430.

Implementation period: 2–3 days.

Use more opportunities of the NPBFX analytical portal:trading signals. Make right trade decisions on sell or buy EUR/USD and other popular instruments using trading signals on the NPBFX portal. All registered users have free access to signals from the top 10 trading indicators (MA10, BBands, Ichimoku, Stochastic, ZigZag, etc.) with also general recommendations on the portal.

If you have any questions about trading instruments, you can always ask an analyst in the online chat on the portal and get a free consultation of an experienced specialist.

Use the current recommendations of analysts on EUR/USD and trade efficiently with NPBFX.
 
Last edited:
XAU/USD: gold prices are rising 30.01.2019

Good afternoon, dear forum visitors!

NPBFX offers the latest release of analytics on XAU/USD for a better understanding of the current market situation and more efficient trading.

Current trend

Gold prices continue to rise steadily, renewing highs since May 2018. The instrument is supported by weak USD and soft Fed’s position, which implies a pause in the monetary tightening.

Investors are focused on new the complication of US-China relations before the trade negotiations on January 30-31. On Monday, the US Department of Justice officially accused the Chinese company Huawei of two dozen crimes; including violating the sanctions regime against Iran and stealing technology from the American company T-Mobile. Acting US Attorney General Matthew Whitaker said that the US would seek extradition of Huawei Finance Director Meng Wanzhou from Canada. Investors fear that the situation could undermine the prospects for a trade deal. China is unlikely to forgive it and may respond by tightening negotiating positions or creating problems for American companies operating in the PRC, for example, Apple.

Support and resistance

On the daily chart, Bollinger bands grow moderately. The price range actively expands but not as fast as the "bullish" develops. MACD grows, keeping a strong buy signal (the histogram is above the signal line). Stochastic reached its highs ​​and reversed horizontally, reflecting that the instrument is strongly overbought the super short term.

The current indicators’ readings do not contradict the further development of the “bullish” trend in the short term. Nevertheless, the correctional dynamics can develop at the end of the week.

Resistance levels: 1314.41, 1317.17, 1320.87.

Support levels: 1308.93, 1304.21, 1298.32, 1292.69.

7-2.jpg


6-5.jpg


Trading tips

Long positions can be opened after the breakout of 1314.41 or 1317.17 with the target at 1320.87 or 1324.00. Stop loss is 1310.00 or 1308.93.

Short positions can be opened after the rebound from 1314.41 and the breakdown of 1308.93 with the target at 1298.32. Stop loss is 1314.41.

Implementation period: 2–3 days.

Use more opportunities of the NPBFX analytical portal:E-book

If you just recently started to be interested in trading on FOREX and would like to deepen your knowledge, an electronic Beginner's Guide to FOREX Trading will be an excellent helper for you here. The book consists of 5 chapters and reflects fundamental concepts of the foreign exchange market to start successful trading. From the main chapters of the E-book you can learn about the concepts and history of FOREX, currencies and trend lines, technical indicators, types of orders, trading on news, psychology of trading, risk management and much more.

You can read a Beginner's guide to FOREX Trading online or download it free of charge from the NPBFX analytical portal in the "Education" section. In order to get unlimited access to the E-book and other useful instruments on the portal, you need to register on the NPBFX website.

If you have any questions about trading instruments, you can always ask an analyst in the online chat on the portal and get a free consultation of an experienced specialist.

Use the current recommendations of analysts on XAU/USD and trade efficiently with NPBFX.
 
USD/CHF: instrument trades ambiguously 01.02.2019

Good afternoon, dear forum visitors!

NPBFX offers the latest release of analytics on USD/CHF for a better understanding of the current market situation and more efficient trading.

Current trend

Yesterday, USD was actively declining against CHF but almost completely recovered at the end of the daily session.

The market remains focused on the outcome of the Fed meeting. Investors were reassured by the intentions of the FOMC to keep patience before the next rate increase and carefully assess the situation. Jerome Powell noted that there were fewer arguments in favor of the rate hike, and the American economy suffered from the Shutdown, but suggested that all losses would be regained in Q2.

Also, investors follow the US-Chinese negotiations that opened yesterday and are awaiting the publication of the December data from the US labor market. The details of the negotiations were not disclosed, but it is known that President Donald Trump can join it.

On Friday, Nonfarm Payrolls will be published. The index may fall from 312K to 165K, but the data may be better than predicted, as evidenced by the positive ADP employment release published previously.

Support and resistance

On the daily chart, Bollinger bands are growing moderately. The price range narrows, reflecting the ambiguous trade nature in the short term. MACD fluctuates but still keeps a weak sell signal (the histogram is below the signal line). Stochastic is reversing into a horizontal plane after a short increase, indicating a decrease in upward corrective risks.

The current readings of technical indicators remain uninformative.

Resistance levels: 0.9962, 0.9980, 1.0000.

Support levels: 0.9933, 0.9904, 0.9871, 0.9847.

usdchf01022019-1e.png


usdchf01022019-2e.png


Trading tips

Long positions can be opened after the breakout of 0.9962 with the target at 1.0000. Stop loss is 0.9945–0.9940. Implementation period: 1–2 days.

Short positions can be opened after the breakdown of 0.9933–0.9915 with the targets at 0.9871–0.9847. Stop loss is 0.9950–0.9962. Implementation period: 2–3 days.

Use more opportunities of the NPBFX analytical portal: economic calendar.

Be ready for any market changes through global events using the economic calendar on the NPBFX portal. The calendar contains all the most important events of the world economy and prognoses for them. In order to get free and unlimited access to the economic calendar and other useful instruments on the portal, you need to pass a one-time registration on the NPBFX website.

If you have any questions about trading instruments, you can always ask an analyst in the online chat on the portal and get a free consultation of an experienced specialist.

Use the current recommendations of analysts on USD/CHF and trade efficiently with NPBFX.
 
NZD/USD: the pair is showing ambiguous dynamics 04.02.2019

Good afternoon, dear forum visitors!

NPBFX offers the latest release of analytics on NZD/USD for a better understanding of the current market situation and more efficient trading.

Current trend

NZD showed a decline on Friday, departing from the updated local high of December 4. The reason for the emergence of "bearish" trend was the publication of positive macroeconomic statistics from the US.

The pressure on USD continues to be exerted by the tense situation around the relations between China and the US, although there are positive moments here. Last week, another round of US-China trade negotiations in Washington ended. Both sides rated them as successful and constructive. The Xinhua Agency mentions that China has agreed to increase imports of agricultural, energy and industrial products from the US, as well as cooperate in the field of intellectual property protection. On Thursday, President Donald Trump announced that Finance Secretary, Steven Mnuchin, and Trade Representative, Robert Lighthizer, would go to China for a new round of talks in mid-February, and Trump could meet with Xi Jinping at the end of February. The market assesses the chances of concluding a deal as good.

Support and resistance

Bollinger Bands in D1 chart show stable growth. The price range expands from above, freeing a path to new local highs for the "bulls". MACD is gradually reversing downwards keeping a previous buy signal (located above the signal line). Stochastic demonstrates similar dynamics, reversing downwards at its maximum levels.

It is worth looking into the possibility of corrective decline in the short and/or ultra-short term.

Resistance levels: 0.6923, 0.6940, 0.6968, 0.7000.

4.jpg


5.jpg


Trading tips

To open long positions, one can rely on the breakout of 0.6923 or 0.6940. Take profit — 0.7000. Stop loss — 0.6900 or 0.6890.

A breakdown of 0.6871 may be a signal to new sales with target at 0.6814 or 0.6789. Stop loss — 0.6900.

Implementation time: 2-3 days.

Use more opportunities of the NPBFX analytical portal:trading signals. Make right trade decisions on sell or buy NZD/USD and other popular instruments using trading signals on the NPBFX portal. All registered users have free access to signals from the top 10 trading indicators (MA10, BBands, Ichimoku, Stochastic, ZigZag, etc.) with also general recommendations on the portal.

If you have any questions about trading instruments, you can always ask an analyst in the online chat on the portal and get a free consultation of an experienced specialist.

Use the current recommendations of analysts on NZD/USD and trade efficiently with NPBFX.
 
Brent Crude Oil: oil prices are consolidating 06.02.2019

Good afternoon, dear forum visitors!

NPBFX offers the latest release of analytics on Brent Crude Oil for a better understanding of the current market situation and more efficient trading.

Current trend

Prices for Brent crude oil showed a decline on Tuesday, remaining close to the local highs of 2019, updated the day before. Poor data on Factory Orders published on Monday in the United States was the reason for the emergence of negative dynamics.

In turn, the instrument is supported by the tense situation around Venezuela, against which the US may impose sanctions. Additional support comes from OPEC, as the cartel intends to continue to cut oil production in order to stabilize supply and demand in the market.

The report of the American Petroleum Institute reflected a moderate increase in oil reserves, which did not contribute to the development of "bullish" trend of the instrument. Over the week up to February 1, US Crude Oil Stock grew by 2.514M barrels after an increase of 2.098M barrels in the previous period.

Support and resistance

Bollinger Bands in D1 chart show unsteady growth. The price range is almost unchanged, significantly limiting the prospects for further growth of the instrument. MACD reversed downwards having formed a weak sell signal (located below the signal line). Stochastic demonstrates a similar trend, reflecting the weakening risks of an overbought instrument in the ultra-short term.

The development of a full-fledged downtrend is possible in the short and/or ultra-short term.

Resistance levels: 62.30, 63.08, 63.69, 64.42.

Support levels: 61.50, 61.00, 60.50, 59.44.

oil06022019-6.png


oil06022019-7.png


Trading tips

To open long positions, one can rely on the rebound from the support level of 61.50 with the subsequent breakout of 62.30. Take profit — 63.69 or 64.42. Stop loss — 61.50.

A breakdown of 61.50 or 61.00 may be a signal to further sales with target at 59.44 or 58.75. Stop loss — 62.00 or 62.30.

Implementation time: 2-3 days.

Use more opportunities of the NPBFX analytical portal: trading signals for commodities.

How can a trader determine if it’s worth buying or selling Brent Crude Oil now or better waiting for a more favorable period? Use trading signals for commodities from the top 10 technical indicators on the NPBFX portal and make the right decisions! All registered users have free and unlimited access to the minutely updated trading signals (MA10, BBands, Ichimoku, Stochastic, ZigZag, etc.) for Gold, Silver, Brent and WTI Crude oil.

If you have any questions about trading instruments, you can always ask an analyst in the online chat on the portal and get a free consultation of an experienced specialist.

Use the current recommendations of analysts on Brent Crude Oil and trade efficiently with NPBFX.
 

Live Forex Chart

Currency
Rates
EUR / USD
1.13459
USD / JPY
156.842
GBP / USD
1.32640
USD / CHF
0.83333
USD / CAD
1.41874
EUR / JPY
178.020
AUD / USD
0.69761
Back
Top
Log in Register