BTC USD 63,127.0 Gold USD 4,289.14
Time now: Jun 1, 12:00 AM

FXCM - FXCM.com

Forex Weekly Trading Forecast - 09.13.10

US Dollar Could Strengthen if Advance Retail Sales Data Disappoints
Euro Won’t be able to Hold Back the Fundamental Tide for Much Longer

Japanese Yen: Will FX Traders Curb Speculation For BoJ Intervention?
British Pound Volatility Depends On Slower Price Growth

Canadian Dollar at Risk of Declines as it Fails to Set Fresh Highs

Australian Dollar May Appreciate Further as Growth Prospects Improve
New Zealand Dollar Awaits RBNZ Rate Decision For Direction

Gold Finally Breaks its Bullish Trend but Does that Guarantee Reversal?

Forex_Weekly_Trading_Forecast_body_Picture_3.png
 
FXCM Strategy Trader Delivers the Next Evolution in Automated Trading

Code, Backtest, Optimize, Trade

New York—September 13, 2010 FXCM Holdings LLC, a global leader in online forex and CFD trading,* recently launched Strategy Trader†—a free, all-in-one automated forex trading solution that allows clients to code strategies, perform advanced backtests, run detailed optimization analysis, and execute trades from a single platform.
Automated trading has recently grown tremendously popular, and for good reason. For one, it can remove the emotional component of decision making inherent to trading. It also frees traders from constantly having to monitor the markets for trade opportunities, while still allowing them to place trades 24 hours a day.

“We believe that our new platform is one of the most advanced retail products available on the market,” says Randy Rupan, Vice President of Systems Trading at FXCM. “Having historical data, advanced analytics, and integrated execution in one package with a price tag of free makes this a unique value proposition for the active trader.”

Integrating seamlessly with FXCM’s No Dealing Desk forex trade execution system, Strategy Trader eliminates the need for software bridges and external APIs, which can result in faster and more efficient trade execution than other automated forex trading platforms. Strategy Trader also updates prices tick-by-tick, providing substantially more price data than platforms that update second-by-second. This feature can dramatically increase the number of potential trading opportunities since there are often multiple ticks per second.

Additionally, Strategy Trader provides clients with 500,000 bars of historical data and the ability to backtest with both bid and ask prices. Over 40 unique performance reports are easily accessed, allowing clients to gain an in-depth understanding of their strategies’ potential in actual market conditions. Strategy Trader also gives traders access to exhaustive, genetic, and walk forward optimization tools, allowing traders to quickly find the most optimal strategy parameters and settings based on past performance.

Why trade with FXCM’s Strategy Trader platform?

• Strategy Trader is FREE to all FXCM account holders
• Uses the C# programming language
• Place trades on tick data
• Free proprietary Grid Strategy Trader EA (stEA)
• Over 100 pre-loaded indicators
• Exhaustive, genetic, and walk forward optimization tools
• No out trades, off quotes, or account syncing required
• Integrated third party data, including DTNIQ
• All orders sit directly on FXCM’s servers

Try FXCM’s Automated Forex Trading platform, Strategy Trader now.

About FXCM Holdings LLC

FXCM Holdings LLC (FXCM) is a leading global forex and CFD broker* that caters to both retail and institutional markets. Founded in 1999, FXCM is one of the largest brokers, regulated by several of the world’s most respected financial authorities.

At the heart of FXCM’s client offering is No Dealing Desk forex trading. Clients have market access to some of the world's largest forex liquidity providers which enables FXCM to offer clients spreads as low as 1 pip on major crosses. Clients also have the benefits of mobile trading, one-click order execution, and trading from real-time charts. Forex Capital Markets Ltd’s CFD product* offers no re-quote trading and allows traders to trade oil, gold, silver, and stock indices, along with forex on one platform. In addition to currency and CFD trading, FXCM offers educational courses on forex trading, and provides free news and research through DailyFX.com.

† Please be advised that this is a beta version. When you undertake transactions on an electronic trading system, you will be exposed to risks associated with the system including but not limited to failure of hardware or software, as such please be sure to review the execution risks.

*Please be advised that CFD accounts are not available to residents of the U.S. or its territories. Additionally, Forex Capital Markets Ltd offers spread betting exclusively to UK residents. Residents of other countries are NOT eligible.
_________________________________________________________________________________________________
Trading foreign exchange and CFDs on margin carries a high level of risk, and may not be suitable for all.
 
Forex Fundamental Trends Monitor 09.13.2010

Forex markets appear poised to extend the upswing in risk appetite, carrying linked currencies higher for a third week, but the divers of the advance appear vulnerable while an ominous set of US economic data looms ahead.

Major Currencies vs. US Dollar (% change)
06 Sep 2010 – 10 Sep 2010


Forex_Fundamental_Monitor_09.13.2010_body_fm09142010_table.png


General Comment:

Sentiment remains the dominant catalyst driving currency markets and risky assets are seemingly poised to advance for a third week, with the MSCI World Stock Index soaring toward Augusts’ swing top after a robust set of Chinese economic data and the unveiling of the Basel III international bank regulatory framework over the weekend.

The East Asian giant reported that Retail Sales topped economists’ forecasts to add 18.4 percent in the year to August and Industrial Production unexpectedly picked up pace, with output growing 13.9 percent over the same period as compared with a 13.4 percent annualized increase in the previous month, stoking optimism about the continuity of the global recovery. Meanwhile, the Basel Committee on Banking Supervision – a multinational group of financial regulators – agreed to a compromise set of new rules aimed at preventing a repeat of the 2008 credit crunch and subsequent recession. Under the new regulatory regime, capital requirements will more than triple to 7 percent of assets, though the scheme will not be fully implemented until 2019, giving lenders over 8 years to comply with its provisions. The announcement served to remove a layer of uncertainty about the future international regulatory environment while suggesting banks will have ample time to raise cash and become compliant, soothing fearsof a sudden retrenchment in lending.

The knee-jerk upswing may not prove sustainable however considering a number of glaring vulnerabilities in the drivers behind the advance. Indeed, the same set of Chinese economic releases that included the aforementioned retail sales and industrial production outcomes also showed that New Yuan Loans rose for the first time in four months in August while the Consumer Price Index ticked up to a 21-month high of 3.5 percent while Money Supply growthaccelerated for the first time since November 2009. This hints that renewed tightening measures may be on the way, an outcome that is likely to prove detrimental to risk appetite.

Turning to Basel III, the long implementation period means that a lot can change about the global economic landscape while the rules are phased in, raising doubts about just how much uncertainty has really been dispelled about their implications for broad-based economic growth. Furthermore, the likelihood of a substantively harsher outcome than what was unveiled from essentially the same group of central bankers that are seemingly so reluctant to tighten domestic monetary policies was surely minimal, hinting the announcement’s market-moving potential may prove short-lived.

On balance, all eyes now point to US economic data as traders continue to view the health of the world’s largest consumer market as the bellwether for the global recovery at large, with weaker Retail Sales and Industrial Production as well as higher Jobless Claims figures expected ahead and threatening the spectrum of risky assets and correlated currencies.

EURUSD:

The correlation between the Euro and the MSCI World Stock Index remains firm, anchoring the single currency to broad trends in risk appetite once again. Germany’s ZEW Survey of investor confidence headlines the domestic calendar, with expectations calling for the closely watched forward-looking Economic Sentiment gauge to drop to the lowest since March 2009. German Industrial Production and a final revision of Augusts’ Consumer Price Index figures are also on tap.

Forex_Fundamental_Monitor_09.13.2010_body_fm09132010_EUR.png


Source: Bloomberg

GBPUSD:

The British Pound has been broadly range-bound in recent weeks and seems likely to remain so as the correlation with risk sentiment trends lower while the economic calendar offers little by way of market-moving releases. Augusts’ Consumer Price Index figures are set to show the annual inflation rate slowed to 3 percent, marking the fourth consecutive decline and reinforcing expectations of a static monetary policy for the foreseeable future. Meanwhile, Jobless Claims are set to inch lower by 3K in August, nearly matching the previous month’s result and keeping the labor market landscape essentially unchanged.

Forex_Fundamental_Monitor_09.13.2010_body_fm09132010_GBP.png


Source: Bloomberg

USDJPY:

Prices continue tracking closely with US Treasury yields, putting the onus on the US economic calendar both in terms of its implications for the monetary policy outlook as well as overall risk appetite given the safe-haven attributes of the Japanese Yen as well as US government debt. The Tertiary Index of service demand amounts to the last bit of noteworthy economic data on the domestic calendar.

Forex_Fundamental_Monitor_09.13.2010_body_fm09132010_JPY.png


Source: Bloomberg

USDCAD, AUDUSD, NZDUSD:

The commodity bloc remains closely tied to risk sentiment, with prices continuing to show significant correlations to the MSCI World Stock Index (CAD: 0.88, AUD: 0.86 and NZD: 0.87). A monetary policy announcement from the Reserve Bank of New Zealand headlines the economic calendar. A Credit Suisse gauge of priced-in expectations suggests Alan Bollard and company will opt to remain on hold this time around, with the focus on the statement accompanying the decision as traders size up where things are likely to go in the months ahead amid growing evidence of a global slowdown in the second half of the year.

Forex_Fundamental_Monitor_09.13.2010_body_fm09132010_CAD.png


Source: Bloomberg

Forex_Fundamental_Monitor_09.13.2010_body_fm09132010_AUD.png


Source: Bloomberg

Forex_Fundamental_Monitor_09.13.2010_body_fm09132010_NZD.png
 
Forex Strategy Corner: Using Parabolic SAR as Trading Strategy

The Parabolic SAR is a popular technical indicator designed to catch major trends and reversal points commonly found on charts across a broad spectrum of asset classes, but how well has it worked in forex market? Through this article we will look at hypothetical results of trading said strategy on major currency pairs. Though past performance is never a guarantee of future results, we hope to gain a better understanding of this indicator and find potential applications for currency trading.

Parabolic SAR: What is it and how do we use it?

The Parabolic SAR is an indicator based on price and time designed to closely follow trends and literally “Stop And Reverse” when they have ended. The dot is drawn as the stop and reverse (SAR) point which is below the price in a downtrend and above the price in an uptrend. Once price hits the stop point, the system would close the existing position and reverse direction with the opposite trade.

Forex_Strategy_Corner_Using_Parabolic_SAR_as_Trading_Strategy_body_Picture_5.png


Acceleration Factor (AF) determines the rate at which the SAR point will converge to current price action. The higher the AF, the more quickly the SAR will converge with price during a trend.

Extreme Point (EP)is the highest high during an uptrend or the lowest low during a downtrend.

The calculation for the Parabolic SAR is such that the “Stop and Reverse” point moves progressively higher and closer to the actual price low as a trend continues. This intuitively makes sense: the longer the trend the more likely it is to reverse. When that reverse occurs, you would want your hypothetical “Stop and Reverse” point as close to current price as possible.

We can vary the speed at which the SAR converges with price via the AF. With each step that price moves to a higher high or a lower low, the SAR point will move closer to a rate directly proportional to the AF. The default value for the AF on most charting packages and in literature is 0.02, while the maximum AF is most often capped at 0.20.

Sample trading rules using the Parabolic SAR are subsequently rather simple: go long when the stop and reverse point is below current price and go short when it is above. Thus we have a simple system to test, and hypothetical performance is easy to calculate using automated trading software.

Forex Parabolic SAR Trading Strategy

Entry Rule:When the Parabolic stop and reverse point is below current price, go long. If price subsequently touches the stop point, close the long position and go short on the open of the next bar.

Stop Loss:Stop and reversal point is the stop loss and point at which the strategy flips direction.

Take Profit: None

Exit Rule:When price hits the stop and reversal point, close the trade at the open of the next bar and flip direction.

Backtesting our Forex Bollinger Band Reversal Strategy

Using FXCM’s Strategy Trader software, we will code a strategy based on this popular technical indicator and see the results. In doing so, we can easily test our concepts across the spectrum of currencies and time frames.

View a video guide on strategy backtesting and optimization in Strategy Trader here:

http://forexforums.dailyfx.com/strategy-trader-webinars/220697-basic-backtesting-optimization.html

Download and install the Strategy Trader platform, then import the following code example from the DailyFX forex forum. Download the attached .zip file. Go to the directory under which you've unzipped the contents of the file. Open the "ParabolicSAR.fxd" file and when prompted by the Strategy Language Editor, hit "OK" to import the file. Once you have imported the Strategy Advisor, open the "ParabolicSAR.fxw" file included in the attached zip to see examples on how you may use this in your charts.

Forex Parabolic SAR Trading Strategy

We ran this strategy on the EURUSD, USDJPY, GBPUSD, and GBPJPY across four different time frames. We assume transaction costs of 3 pips on the EURUSD, USDJPY, and GBPUSD and 5 pips on the GBPJPY per round-trip trade. Below are the hypothetical equity curves of said strategy run across four different time frames.

Forex_Strategy_Corner_Using_Parabolic_SAR_as_Trading_Strategy_body_Picture_6.png


Though past performance is no guarantee of future returns, the strategy shows promise in trading these select currency pairs. Yet the breakdown between timeframes is telling.

On the low-frequency end, the strategy does not seem to fare particularly well on a weekly chart. It seems as though the Parabolic SAR has historically been too slow in picking up on shifting trends in these four currencies over the past 8 or so years of trading.

On the high-frequency end, the Parabolic SAR is far more nimble yet nonetheless does poorly across these four currency pairs through the selected time period. Yet the reason for said underperformance has less to do with the indicator itself and more to a common failing of many high-frequency strategies: transaction costs.

For EURUSD pair alone, this strategy theoretically generated a whopping 4481 trades over the testing period. On round-trip spreads, this would have amounted to nearly $15,000 over the course of 8 years based on our spread assumptions. Without that extra transaction cost, the strategy would have theoretically generated a profit on the currency pair.

The Parabolic SAR indicator seems to find its best results somewhere in between the low-frequency and high-frequency extremes. If we take a look at the results on 240-minute and 1-Day charts, the strategy has hypothetically done relatively well over the years. This is especially true during times of strong and extended price trends. Like many trend-based indicators, the Parabolic SAR can get chopped out during range-bound price action.

Applying Our Analysis to Existing Strategies/Trading Styles

Hypothetical backtests show that our benchmark Parabolic SAR strategy has performed relatively well on several major currency pairs over the past 8 years of trading. Given that SAR can likewise be used as a method to set trailing stops for many trend trades, we can see how this could apply to our own trading.

We encourage you to download the strategy and run different combinations of said systems on currency pairs and time frames. Strategy Trader will likewise allow you to run multiple strategies on the same chart—particularly useful in gauging the historical effectiveness of Parabolic SAR in setting stops for existing trading techniques.
 
Euro Looks Poised To Push Higher, British Pound Weighed By Growth Concerns

The Euro extended the rebound from the 100-Day SMA (1.2646) to reach a fresh weekly high of 1.3108 and the single-currency looks poised to test the 200-Day SMA at 1.3244 as it breaks out of the narrow range carried over from the previous month.

Talking Points

* Japanese Yen: Modestly Higher Against Most Currencies
* Pound: Retail Spending Unexpectedly Contracts
* Euro: Extends Weekly Rally
* U.S. Dollar: Producer Prices, Net TIC Flows Tap


The near-term rally in the EUR/USD appears to be gathering pace and looks as though it will continue to pare the decline from August, but we cannot rule out a risk for a corrective retracement in the coming days as the daily RSI approaches overbought territory. As a result, if price action fails to break above the 200-Day SMA, the exchange rate may congest within a narrow range in the months ahead as investors weigh the prospects for future policy.

European Central Bank board member Mario Draghi, who is also the chairman of the Financial Stability Board, said the new regulations will be “effectively addressing the issues of too-big-to-fail institutions” according to an article in an Italian newspaper, and went onto say that the larger financial institutions should have a higher capital requirement than agreed by the Basel Committee on Banking Supervision in order to withstand future losses. As policy makers pledge to incorporate stringent rules on the banking sector, the efforts to preserve financial stability could pose a risk to the recovery as banks continue to scale back on lending. As a result, the European Central Bank is likely to maintain the expansion in monetary policy going into 2011, and mounting uncertainties surrounding the economic outlook could weigh on the exchange rate even as the Governing Council talks down the risks for the region.

The British Pound halted the three-day rally and slipped to a low of 1.5537 during the European trade as the economic docket reinforce a weakened outlook for future growth. Retail spending in the U.K. unexpectedly slipped 0.4% in August amid forecasts for a 0.2% rise, while sales including auto fuel fell 0.5% during the same period versus forecasts for a 0.3% rise. The reversal in the exchange rate suggests price action may trend sideways over the near-term as it fails to test the 38.2% Fibonacci retracement from the 2009 low to high at 1.5700, and the pair may fall back towards 1.5300 to test for support. At the same time, a survey by the Bank of England showed consumer inflation expectations rose to its highest level since August 2008 as households anticipate price growth to reach an annual pace of 3.4% next year. The stickiness in prices could lead to an increased split within the MPC, which would produce increased volatility in the exchange rate as investors weigh the prospects for future policy.

The greenback strengthen against most of its major counterparts on Thursday, with the USD/JPY bouncing back from a low of 85.21 during the overnight trade, and the greenback may continue to push higher throughout the day as it benefits from a rise in safe-haven flows. Nevertheless, the economic docket is expected show producer prices in the world’s largest economy is forecasted to fall back to an annualized pace of 3.1% in August from 4.2% in the previous month, while demands for U.S. assets are projected to increase $42.0B in July after expanding $44.4B in the previous month. As price growth weakens, the data could lead market participants to scale back expectations for the Fed to normalize monetary policy in the coming months as the central bank maintains a dovish outlook.
 
Taking A Step Back; Here Are Two Trades We Love Over the Next 12 Months

It seems as though the market close on Thursday has encouraged some fresh currency long positions with the Euro failing to show any signs of stalling and in fact accelerating to fresh multi-days highs beyond 1.3100.

FUNDYS

This has propelled gains in the antipodeans, which even outperform the Euro on the day thus far, while all other major currencies are also tracking higher against the buck. For now, the key level to watch above comes in by 1.3170 which represents the 78.6% fib retracement off of the major August high-low move. The 78.6% fib retrace is the final defense for USD bulls, with a close above this level to likely open a complete retracement back towards 1.3335.

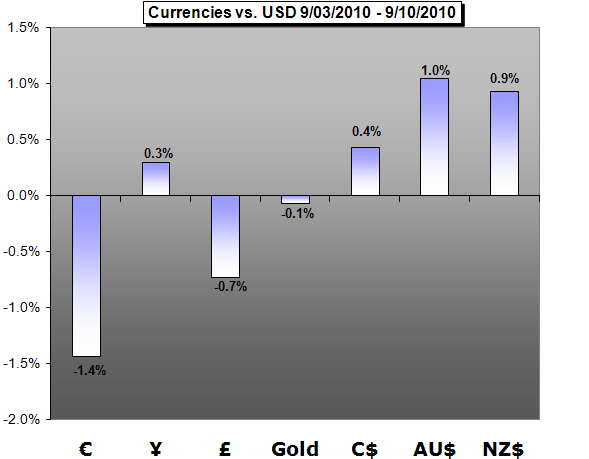
Relative Performance on Friday Versus the USD (as of 09:30GMT) –

1)KIWI +1.05%

2)AUSSIE +0.94%

3)STERLING +0.51%

4)EURO +0.42%

5)CAD +0.33%

6)YEN -0.05%

7)SWISSIE -0.13%


While the Yen and Swissie are also higher against the buck, gains in these currencies are only marginal, and this is completely understandable given the recent shift in policy from both respective central banks. In Japan, the central bank has aggressively reentered the market to intervene on behalf of the Yen this week, while in Switzerland, the SNB has come out with a much more downbeat assessment of the economy, while also expressing deep concern over the negative impact that the appreciation in the Franc is having on local business.

With the calendar fairly light in Friday trade, we would like to take the opportunity to present two medium-term to longer term trading ideas that we feel are highly compelling:

Taking_a_step_back_body_1.png


The Eur/Chf cross has recently dropped to fresh record lows below 1.2800 before finally finding some form of relief over the past few sessions. However, we contend that there is plenty more upside ahead, with the monthly RSI only just now crossing up from oversold levels. Fundamentally, should risk appetite start to really pick-up, the cross should certainly benefit, with much of the relative strength in the Swiss Franc over the past several months coming from its safe haven appeal. But we also see decent risk to the upside even in the event of a less upbeat market environment in light of the SNB’s serious concerns over the level of the Franc and its negative impact on the economy. It should also be noted that a long position in this cross offers a positive carry, albeit a baby carry, that effectively pays investors for every day that they hold the position. We contend that the yield differential which already favors the Euro, will become even more attractive going forward as the ECB eventually begins to reverse monetary policy.

Taking_a_step_back_body_2.png


Eur/Aud is another cross rate which we believe has fully run its course and is now on the final leg of an intense downtrend. This cross now shows a monthly RSI that is severely oversold and well below 30. While a long position in the cross is certainly less attractive from a rate differential standpoint, the market is clearly at some major cyclical lows and shows enough upside potential to more than offset any fallout out from the negative carry. Fundamentally, should risk appetite pick-up, we believe that most of the strength of the Australian economy is as priced in as possible. But in the Eurozone, there is much less optimism priced into the market, which theoretically opens the door for a faster appreciation on a relative basis in the Euro. In contrast, should we continue to see a global macro economy that is seriously uncertain and fearful over the outlook for the global economy, we also believe there is tremendous upside potential for the cross, with the RBA then becoming much more uncomfortable with its tightening policy and most probably forced to reconsider just how fast rates were hiked over the past few months. Certainly a negative risk global environment supports the argument for a shift from higher yielding currencies to lower yielding ones, which effectively would translate into a higher cross rate. Remember, the Australian economy is extremely reliant on the success and growth of China and India, and should there be any signs of weakness there, the Australian Dollar will be at risk for major depreciation.

We do not recommend any specific positions in these crosses at this point, but would instead just like to bring these markets to your attention in case any of you are looking for a low leverage longer-term play. These are certainly two of our favorite trades over the next 12 months.

Looking aheadto the North American economic calendar,US consumer prices (0.3% expected) are out at 12:30GMT, followed by University of Michigan confidence (70.0 expected) at 13:55GMT. US equity futures are pointing to a firmer open, while oil and gold are also well bid. Gold continues to extend gains to fresh record highs. Have a good weekend.

USD GRAPHIC REWIND

Taking_a_step_back_body_dxy9.png


TECHS

EUR/USD: The daily close above the 61.8% fib retracement off of the major move from August has seriously dampened bearish prospects, with the market racing above 1.3100 thus far. Next key resistance comes in by 1.3170 which represents the 78.6% fib retracement off of the August move, and the final line of defense for USD bulls before a full retracement to 1.3335. A close above 1.3170 will open a direct retest of the critical 1.3335 highs , while a close below will still keep alive the potential for a bearish resumption. For now, 1.2975 is the key short-term level to watch below, with the break to officially relieve topside pressures.

USD/JPY: The major downtrend could finally be at risk of expiring following the latest surge back above the 20-day SMA. Wednesday’s close above the 20-Day SMA was indeed the first obstacle that needed to be overcome to potentially force a shift in the structure, while the next test will be the Ichimoku cloud bottom that comes in around 86.20. Daily studies certainly show plenty of room for additional upside, so we would look for a break into the cloud (currently defined roughly between 86.20-88.50) before considering any possibility of a bearish resumption.

GBP/USD: The latest break back above 1.5700 threatens the integrity of the downtrend and potentially exposes a move back towards 1.6000 over the coming sessions. It is however worth noting that the 61.8% fib retracement off of the 1.6000-1.5295 move, comes in by 1.5730, and should we manage to close below this level, the bearish structure will remain intact.

USD/CHF: Finally showing some serious signs of a material base, with the market very well supported on dips below par. Medium-term and longer-term technical studies certainly confirm the possibility of some major upside ahead, but for now, we will need to see a break back above next key topside barriers by 1.0280 to reaffirm recovery prospects.

FLOWS

Real money accounts are buyers in both Eur/Chf and Eur/Jpy, a European hedge fund was a noted seller in Eur/Gbp. Japanese mega bank buying followed by specs in Usd/Jpy. Asian sovereign accounts are on the bid in Eur/Usd.

TRADE OF THE DAY
Taking_a_step_back_body_tradeofday.png


AUD/USD:We like the idea of fading any rallies towards 0.9500 with the psychological barrier offering itself as a formidable medium-term resistance zone. While the market has managed to break to fresh 2010 and multi-month highs to potentially open the door for an upside extension towards 0.9800, we do not see things playing out this way, with the current move classified more as a minor overshoot that should ultimately result in yet another major medium-term top. Indeed the daily RSI has crossed above the 70 threshold to confirm the overbought nature of daily studies and reaffirm our bearish bias, while hourly studies are also supportive of the counter-trend position. Ultimately, only a close back above 0.9460 would negate and give reason for concern. POSITION: SHORT @0.9462 FOR AN OPEN OBJECTIVE; STOP @0.9562.
 
EUR/CHF Classical 09.20

tech_09_20_EURCHF_body_eurchf2.jpg


EUR/CHF: The market could finally have found a major base by the recently set record lows at 1.2765, with weekly and monthly studies looking stretched and finally starting to correct. An unconventional double bottom formation has triggered on the daily chart which should now open next upside towards 1.3500 over the coming sessions. For now, look for any setbacks to be well supported by previous resistance turned support in 1.3100 area.
 
Canadian Consumer Prices Unexpectedly Slows to 1.7 Percent in August

Canadian Consumer Prices Unexpectedly Slows to 1.7 Percent in August

Canadian_Consumer_Prices_Unexpectedly_Slows_1.7_Percent_in_August_body_fxheadlines.jpg


Canadian_Consumer_Prices_Unexpectedly_Slows_1.7_Percent_in_August_body_fxb.png


Fundamental Headlines

• Stimulus Plan Bogged Down in Bureaucracy – Wall Street Journal

• North Korea Sets Date for Political Meet – Wall Street Journal

• Gulf States in $123 Billion U.S. Arms Spree - Financial Times

•Europe Markets Rallying as Ireland, Spain Debt Sales Buoy Equities, Euro- Bloomberg

• Ireland Market Confidence Increases as Debt Sale Narrows Spread to Germany– Bloomberg


USDCAD: Annualized consumer prices slowed to 1.7 percent in August from 1.8 percent the previous month amid economists’ forecasts of 1.9 percent, the statistics Canada said today. Meanwhile, the monthly figures dropped 0.1 percent as the reading was weighed by transporation prices which fell 0.3 percent, while shelter prices decreased for the first time since March of this year. At the same time, lower prices for home and mortgage insurance, and natural gas weighed on the August report. Going forward, traders are pricing in a 40 percent chance (down from 43.6 percent yesterday) that policy makers will hike rates twenty five basis points at its next rate decision meeting on October 19th, according to the Credit Suisse overnight index swaps. In terms of price action, the pair looks to remain capped by the 10-day SMA ahead of the FOMC rate decision later on today. Not to overlook, our speculative sentiment index stands at 2.15 and signals for additional losses.
 
Forex: Euro Halts Three-Day Rally, U.S. Dollar Benefits From Safe-Haven Flows

Talking Points

* Japanese Yen: Benefits From Risk Aversion
* Pound: BoE Sees “Substantial Headwinds”
* Euro: Manufacturing, Services Slows More-Than-Expected
* U.S. Dollar: Existing Home Sales, Leading Indicator on Tap

Dismal data coming out of the Euro-Zone pushed the single-currency to a low of 1.3311 during the overnight trade, and the exchange rate may continue to push lower throughout the day as investors scale back their appetite for risk. The EUR/USD halted the three-day rally, with the daily relative strength index pulling back from overbought territory, and we may see the exchange rate fall back towards the 200-Day SMA at 1.3208 going into the end of the week to test for short-term support. As the RSI falls from a high of 74, the downturn in the oscillator suggest that a corrective retracement will unfold going into the following week, and a break below the 200-Day moving average is likely to expose the 38.2% Fibonacci retracement from the 2009 high to the 2010 low around 1.3120-30.

Meanwhile, the economic docket showed manufacturing and service-based activity in the Euro-Zone grew at a slower pace in September, with the composite index falling back to 53.8 from a revised 56.2 in July amid forecasts for a 55.7 print. At the same time, a spokesman for the European Commission talked down fears surrounding Greece and said that there is “no discussion” of providing addition funds to the ailing economy” during a press release in Brussels. The commission went onto say that it expects borrowing rates for Greece to normalize by the end of its three-year program, but the austerity measures taken on by the government is likely to weigh on the recovery as policy makers withdraw fiscal support. As the rebound in economic activity cools, managing the downside risks for the region will certainly become an increasing challenge for the European Central Bank, and the uncertainties surrounding the growth outlook could weigh on the exchange rate over the medium-term as the Governing Council expects to see an “uneven” recovery.

The British Pound held within the previous day’s range, with the exchange rate rising to 1.5305 during the European trade, and the currency may hold steady throughout the day as price action fails to hold above the 38.2% Fibonacci retracement from the 2009 low to high around 1.5700. As the GBP/USD carves a near-term top, the exchange rate my work its way back towards the lower bounds of its recent range going into the end of the week, which lies around 1.5300. Nevertheless, Bank of England Chief Economist Spencer Dale said the U.K. faces “substantial headwinds” as the banking sector remains fragile, and went onto say that the economic recovery needs to be sustainable during an interview with the Western Mail. As policy makers hold a cautious outlook for the region, we are likely to see the BoE maintain the expansion in monetary policy throughout the remainder of the year, but the stickiness in price growth could spur interest rate expectations as inflation continues to hold above the government’s 3% limit.

The greenback bounces back against most of its major counterparts, while the USD/JPY fell back from a high of 84.66 ahead of the U.S. trade, and the dollar may continue to gain ground throughout the day as it benefits from safe-haven flows. Nevertheless, the economic docket is expected to show existing home sales in the world’s largest economy increase 7.1% in August following the record-pace of contraction during the previous month, while the leading indicator is projected to tip 0.1% for the second consecutive month in August. As risk sentiment continues to dictate price action in the currency market, the data could stoke a rebound in market sentiment as the outlook for future growth improves.
 
Code and Compete for $20,000 in Prizes with the FXCM Automated Trading Challenge

FXCM Holdings LLC, a global leader in online forex and CFD trading,* is holding an automated forex trading demo contest, which begins October 17. Contestants will use FXCM's Strategy Trader platform† to automate their forex trades during a seven week trading period. Registration is now open so you can register for a demo and start coding your strategy.

WHAT IS STRATEGY TRADER?
FXCM Strategy Trader is an automated forex trading platform that allows you to code, backtest, optimize, and trade from one platform. The FXCM Strategy Trader platform is a unique automated forex trading platform and advanced analytical charting package in that the software is absolutely free and no APIs or software bridges are required. Strategy Trader uses the open source C# programming language, allowing you to code and debug in Microsoft Visual Studio™.

HOW DO I CODE IN C# PROGRAMMING LANGUAGE?
FXCM has a dedicated programming services division that is able to leverage its experience and expertise to help clients implement their automated forex strategies. The group has created guides and resources, such as forexcodesource.com, to assist traders in coding their strategies in C#. Our programming services department can take on coding projects for traders that have no experience in coding but do have a strategy they would like to implement.

HOW DO I WIN THE STRATEGY TRADER CHALLENGE?
Traders who register and automate their strategies by the open of FXCM's trading day on Sunday, October 17, 2010, can compete in the Strategy Trader Challenge. Prizes will be awarded to the Strategy Trader Expert Advisor (stEA) with the highest gross P/L as of the end of FXCM's trading day on Friday, December 3, 2010.
This contest is a demo contest with prizes for first, second, and third place finishers.

First Place: $10,000
Second Place: $7,000
Third Place: $3,000

Important Dates:

September 7: Contest registration opens. Begin coding and testing your automated strategy to prepare for the first day of the contest.

October 15: A starting balance of $1,000 will be used for the official contest. Therefore, at the close of trading on October 15 contest demo accounts will be automatically reset to $1,000 and any open positions will be settled.

October 17: Contest officially begins when trading opens on Sunday, October 17. Participants should activate their automated strategies for trading. There will be a leader board on the contest homepage, which will update hourly with the current contest leaders.

December 3: Contest trading period ends. Final equity levels will be recorded and prizes will be awarded to the top three contestants.

Additional information including contest rules and FAQs can be found on the contest website: http://www.fxcm.co.uk/automated-fore...ng-contest.jsp

About FXCM Holdings LLC
FXCM Holdings LLC (FXCM) is a leading global forex and CFD broker* that caters to both retail and institutional markets. Founded in 1999, FXCM is one of the largest brokers, regulated by several of the world’s most respected financial authorities.
At the heart of FXCM’s client offering is No Dealing Desk forex trading. Clients have market access to some of the world's largest forex liquidity providers that enables FXCM to offer clients spreads as low as 1 pip on major crosses. Clients also have the benefits of mobile trading, one-click order execution, and trading from real-time charts. Forex Capital Markets Ltd.’s CFD product* offers no re-quote trading and allows traders to trade oil, gold, silver, and stock indices, along with forex on one platform. In addition to currency and CFD trading, FXCM offers educational courses on forex trading, and provides free news and research through DailyFX.com.
*Please be advised that CFD accounts are not available to residents of the U.S. or its territories. Additionally, Forex Capital Markets Ltd. offers spread betting exclusively to UK residents. Residents of other countries are NOT eligible.
†Please be advised that this is a beta version. When you undertake transactions on an electronic trading system, you will be exposed to risks associated with the system including but not limited to failure of hardware or software, as such please be sure to review the execution risks.
Trading foreign exchange and CFDs on margin carries a high level of risk, and may not be suitable for all. Read full disclaimer
 

Live Forex Chart

Currency
Rates
EUR / USD
1.15084
USD / JPY
160.025
GBP / USD
1.33216
USD / CHF
0.79812
USD / CAD
1.39512
EUR / JPY
184.162
AUD / USD
0.70481
Back
Top
Log in Register