BTC USD 86,279.2 Gold USD 4,358.48
Time now: Jun 1, 12:00 AM

✅ 📊 Market Recap & Next-Day Setups

🗓️ High-Impact Economic Calendar – October 27, 2025​

📉 Monday’s session offers a concise but pivotal set of releases, with a focus on business sentiment in Germany and durable goods trends in the U.S. The Ifo survey provides an updated gauge of confidence across the EU’s largest economy, while U.S. manufacturing and order flows could shape expectations for Q4 activity.

Preparing ahead of high-impact releases is essential. These events can sharply move markets, widen spreads, and influence central bank expectations. Tracking forecasts lets you manage risk and adjust positions effectively.

🕒 Timeline: GMT | 💱 Focused Currencies: EUR, USD


🕒 09:00 GMT
🇩🇪 Germany – Ifo Business Climate
Forecast: 87.0 | Previous: 87.7
💱 Currency: EUR
💡 Why Traders Care:
The Ifo index is a key forward-looking indicator of economic confidence in Germany. A decline may confirm lingering recession risks and weigh on the euro.


🕒 12:30 GMT
🇺🇸 United States – Durable Goods Orders MoM
Forecast: -1.2% | Previous: 2.9%
💱 Currency: USD
💬 Market lens:
A sharp pullback in durable goods would signal softening capital investment. Markets may interpret this as a headwind to Q4 growth momentum.


🕒 14:30 GMT
🇺🇸 United States – Dallas Fed Manufacturing Index
Forecast: -2.0 | Previous: -8.7
💱 Currency: USD
🎯 Market mover:
An improved reading may point to bottoming sentiment in the regional manufacturing sector. Persistent contraction, however, would deepen concern over U.S. industrial resilience.


✅ Monday’s data is light in volume but rich in macro signals. Traders will closely monitor whether German firms are regaining optimism and if U.S. manufacturers are sustaining investment or showing early signs of slowdown.


The chart below displays EUR/USD in five-minute intervals following the German Ifo Business Climate release on September 24, 2025, capturing the news-driven move and ensuing volatility to illustrate how a single data point can swiftly influence market sentiment and the euro.

EURUSD Ifo.jpg


Ifo Business Climate Release - 24 September 2025

Germany’s business morale fell to 87.7 in September from a revised 88.9 in August, missing the 89.3 consensus, the Ifo institute reported, as firms turned more downbeat on both current conditions and expectations. Economists cited a weak outlook, sluggish reforms, and earlier Q2 GDP −0.3% q/q as drags; the decline was broad-based except construction. While some see growth only meaningfully picking up next year with fiscal loosening—and even then below consensus—the HCOB flash composite PMI showed activity accelerating to a 16-month high, suggesting the economy was growing again, albeit only weakly.


Profit Study

The Profit Study below illustrates the required margin and potential profit for this setup, using examples that show how leverage impacts trading outcomes.

At the time of this release, EUR/USD traded at 1.17874

  • At an open price of 1.17874, trading 1 standard lot with 1:500 leverage required a margin of $235.75 USD.
  • At the same open price and 1:2000 leverage, the required margin dropped to $58.94 USD.

Pip Value (EUR/USD): $10 USD per pip per standard lot.

For instance, a short entered at Point A (1.17874) and closed at Point B (1.17302) would have captured 57.2 pips, yielding a $572 USD profit on one standard lot.


Disclaimer: The content provided is for educational and informational purposes only. This analysis seeks to enhance your understanding of market behavior and highlight potential opportunities that may have existed, offering insights into how the market operates and the possibilities it may present.
 

🗓️ High-Impact Economic Calendar – October 28, 2025​

📊 Tuesday features forward-looking sentiment indicators from both Germany and the United States, giving markets insight into household confidence and regional manufacturing momentum. These readings help assess broader economic health amid lingering global uncertainty.

Being prepared for high-impact events is crucial, as they can cause sharp price movements and shift policy expectations. Monitoring forecasts allows you to plan entries, reduce exposure, and manage volatility in real time.

🕒 Timeline: GMT | 💱 Focused Currencies: EUR, USD


🕒 07:00 GMT
🇩🇪 Germany – GfK Consumer Confidence
Forecast: -23 | Previous: -22.3
💱 Currency: EUR
💬 Market lens:
Deteriorating sentiment among German consumers suggests persistent concerns around inflation and purchasing power. A weaker print may pressure EUR and weigh on retail sector outlooks.


🕒 14:00 GMT
🇺🇸 United States – Richmond Fed Manufacturing Index
Forecast: -10 | Previous: -17
💱 Currency: USD
🔍 Market insight:
While still in contraction territory, an improvement would hint at stabilizing factory conditions in the Mid-Atlantic region. Persistent weakness may dampen broader growth confidence.


✅ Tuesday’s releases provide valuable clues about economic resilience on both sides of the Atlantic. Consumer pessimism in Germany and regional factory strain in the U.S. could influence policy expectations and market direction.


Note: U.S. government data could be affected by the shutdown, with some releases subject to delay, revision, or cancellation
 

🗓️ High-Impact Economic Calendar – October 29, 2025​

⚡ Wednesday’s session is packed with critical inflation data from Australia and major central bank rate decisions from Canada and the U.S. These releases are expected to significantly influence currency volatility and interest rate expectations heading into the final months of the year.

Preparing ahead of high-impact economic releases is essential. They often trigger sharp intraday moves, affect spreads, and alter trading bias. Viewing forecasts in advance helps manage exposure and plan execution more effectively.

🕒 Timeline: GMT | 💱 Focused Currencies: AUD, JPY, CAD, USD


🕒 00:30 GMT
🇦🇺 Australia – Inflation Rate Year-on-Year
Forecast: 2.9% | Previous: 2.1%
💱 Currency: AUD
💬 Market lens:
A sharp rebound in annual inflation could reignite RBA policy tightening discussions. A hotter print may boost AUD on rate hike expectations.

🕒 00:30 GMT
🇦🇺 Australia – Monthly CPI Indicator
Forecast: 3.0% | Previous: 3.0%
💱 Currency: AUD
💡 Why Traders Care:
This gauge offers a timelier look at Australian inflation and is closely monitored by markets and the RBA for early trend signals.


🕒 05:00 GMT
🇯🇵 Japan – Consumer Confidence
Forecast: 35.5 | Previous: 35.3
💱 Currency: JPY
🔍 Market insight:
Confidence remains weak as households face cost pressures and economic uncertainty. Persistent pessimism may weigh on JPY sentiment.


🕒 13:45 GMT
🇨🇦 Canada – BoC Interest Rate Decision
Forecast: 2.25% | Previous: 2.50%
💱 Currency: CAD
💡 Why Traders Care:
Short-term interest rates are the paramount factor in currency valuation — traders monitor this decision closely for monetary policy direction.


🕒 18:00 GMT
🇺🇸 United States – Fed Interest Rate Decision
Forecast: 4.00% | Previous: 4.25%
💱 Currency: USD
🎯 Market mover:
The Fed’s rate call anchors global monetary policy expectations. A shift or dovish language may cause significant dollar repricing.

🕒 18:30 GMT
🇺🇸 United States – Fed Press Conference
💬 Why Traders Care:

It’s a detailed record of the FOMC’s most recent meeting, providing in-depth insights into the economic and financial conditions that influenced their vote on where to set interest rates.


✅ Wednesday’s lineup is policy-centric, spotlighting rate decisions from the Fed and BoC, alongside pivotal inflation prints from Australia. Traders will focus on whether global central banks maintain tightening paths or signal caution amid growth concerns.


The chart below shows GBP/USD on a 5-minute scale following the Fed Funds Rate release on September 17, 2025, capturing the pair’s immediate reaction, the resulting volatility, and how a single release can swiftly shift sentiment and impact the USD.

GBPUSD Fed.jpg


Fed Interest Rate Decision - 17 September 2025

At its September 2025 meeting, the Federal Reserve cut policy rates by 25 bps to a target range of 4.00%–4.25%, marking the first reduction of the year and restarting an easing cycle paused since late 2024. The decision reflected a shift in the Fed’s risk assessment, as officials acknowledged that job gains had slowed, unemployment had edged higher, and downside risks to employment had risen. While inflation was still described as “somewhat elevated,” the Committee removed earlier language referring to a “solid” labor market—indicating greater concern about softening conditions.

The vote was 11–1, with Governor Stephen Miran dissenting in favor of a larger 50 bp cut, highlighting a dovish undercurrent within the Committee. Alongside the decision, the Fed’s Summary of Economic Projections (SEP) pointed to two additional rate cuts by year-end and one more in 2026. The median fed funds rate forecast for end-2025 dropped to 3.6%, implying a year-end range around 3.5%–3.75%. Projections showed slightly stronger real GDP growth (+0.1–0.2 ppts), modestly lower unemployment in 2026–2027 (down 0.1 ppt), and upward revisions to core and headline PCE inflation for 2026 (+0.2 ppts).

The Fed signaled it remains data-dependent but is now biased toward further easing. While balance sheet runoff will continue, the removal of prior references to “further firming” in the statement underscores the pivot. Chair Powell emphasized flexibility in future moves, and markets broadly interpreted the meeting as dovish. With policy still above neutral and labor data weakening, the Fed is expected to deliver two more cuts this year—likely in October and December—before moving to a slower quarterly pace in 2026.


Profit Study

The Profit Study below illustrates the required margin and potential profit for this setup, using examples that show how leverage impacts trading outcomes.

At the time of this release, GBP/USD traded at 1.36664

  • If entered at the highest point 1.37264, trading 1 standard lot with 1:500 leverage required a margin of $274.53.
  • At the same entry price and 1:2000 leverage, the required margin dropped to $68.63.
Pip Value (GBP/USD): $10 USD per pip per standard lot.

For instance, a short entered at Point A (1.37264) and closed at Point B (1.36195) would have captured 106.9 pips, yielding a $1,069 USD profit on one standard lot.

Disclaimer: The content provided is for educational and informational purposes only. This analysis seeks to enhance your understanding of market behavior and highlight potential opportunities that may have existed, offering insights into how the market operates and the possibilities it may present.
 

Attachments

🗓️ High-Impact Economic Calendar – October 31, 2025​

⚡ Friday’s lineup featured inflation reads from Australia and France, factory momentum from China, retail trends in Germany and Switzerland, Euro Area flash inflation, and the Fed’s preferred U.S. inflation gauge alongside Canada’s monthly GDP and the Chicago PMI. Together, these releases offered a clean cross-section of prices, demand, and production across major economies.

Preparing ahead of high-impact releases proved essential, as these events often triggered sharp volatility, widened spreads, and shifted intraday direction within seconds. Reviewing forecasts in advance helped traders plan entries, manage risk, and avoid surprise moves.

🕒 Timeline: GMT | 💱 Focused Currencies: AUD, CNY, EUR, CHF, USD, CAD


🕒 00:30 GMT
🇦🇺 Australia – Producer Price Index Year-on-Year
Forecast: 3.2% | Previous: 3.4%
💱 Currency: AUD
💡 Why Traders Care:
PPI tracked upstream price pressures. A softer annual pace signaled easing pipeline inflation that historically fed into CPI and rate expectations.


🕒 01:30 GMT
🇨🇳 China – NBS Manufacturing PMI
Forecast: 49.5 | Previous: 49.8
💱 Currency: CNY
💬 Market lens:
The headline PMI captured factory demand and employment. A sub-50 read pointed to contraction risk that often weighed on cyclical sentiment region-wide.


🕒 07:00 GMT
🇩🇪 Germany – Retail Sales Month-on-Month
Forecast: 0.1% | Previous: -0.2%
💱 Currency: EUR
🔍 Market insight:
Retail volumes reflected household demand. A marginal rebound suggested fragile spending momentum.

🕒 07:00 GMT
🇩🇪 Germany – Retail Sales Year-on-Year
Forecast: 1.9% | Previous: 1.8%
💱 Currency: EUR
💡 Why Traders Care:
Annual growth offered a cleaner trend signal. A steady uptick supported the view that consumption stabilized despite prior volatility.


🕒 07:30 GMT
🇨🇭 Switzerland – Retail Sales Month-on-Month
Forecast: 0.1% | Previous: -0.2%
💱 Currency: CHF
💬 Market lens:
A modest monthly rise hinted at a near-term pickup in consumer activity.

🕒 07:30 GMT
🇨🇭 Switzerland – Retail Sales Year-on-Year
Forecast: -0.5% | Previous: -0.2%
💱 Currency: CHF
🎯 Market mover:
A deeper annual decline underscored demand headwinds, tempering CHF’s domestic growth backdrop.


🕒 07:45 GMT
🇫🇷 France – Producer Price Index Month-on-Month
Forecast: -0.1% | Previous: -0.2%
💱 Currency: EUR
💡 Why Traders Care:
Sequential PPI deflation indicated subdued cost pressures at the factory gate.

🕒 07:45 GMT
🇫🇷 France – Producer Price Index Year-on-Year
Forecast: 0.2% | Previous: 0.1%
💱 Currency: EUR
💬 Market lens:
A low but rising annual PPI suggested stabilization after prior disinflation.

🕒 07:45 GMT
🇫🇷 France – Inflation Rate Year-on-Year
Forecast: 1.2% | Previous: 1.2%
💱 Currency: EUR
🔍 Market insight:
Headline CPI stability reinforced a benign price environment relative to ECB targets.

🕒 07:45 GMT
🇫🇷 France – Inflation Rate Month-on-Month (Prelim)
Forecast: 0.3% | Previous: -1.0%
💱 Currency: EUR
🎯 Market mover:
A monthly rebound after a sharp drop pointed to normalizing seasonal effects and energy swings.


🕒 10:00 GMT
🇪🇺 Euro Area – Inflation Rate Year-on-Year (Flash)
Forecast: 2.1% | Previous: 2.2%
💱 Currency: EUR
💡 Why Traders Care:
A further easing toward 2% reinforced the disinflation trend that shaped ECB rate-path discussions.

🕒 10:00 GMT
🇪🇺 Euro Area – Inflation Rate Month-on-Month (Flash)
Forecast: 0.2% | Previous: 0.1%
💱 Currency: EUR
💬 Market lens:
A firmer monthly print tracked near-term price momentum despite softer annual rates.

🕒 10:00 GMT
🇪🇺 Euro Area – Core Inflation Rate Year-on-Year (Flash)
Forecast: 2.3% | Previous: 2.4%
💱 Currency: EUR
🔍 Market insight:
Core slowed further, signaling cooler underlying pressures excluding energy and food.


🕒 12:30 GMT
🇺🇸 United States – Core PCE Price Index Year-on-Year
Forecast: 2.8% | Previous: 2.9%
💱 Currency: USD
💡 Why Traders Care:
As the Fed’s preferred gauge, a lower core pace supported the narrative of gradual disinflation.

🕒 12:30 GMT
🇺🇸 United States – Core PCE Price Index Month-on-Month
Forecast: 0.1% | Previous: 0.2%
💱 Currency: USD
💬 Market lens:
A softer monthly increase pointed to cooler near-term price pressure and tempered policy urgency.

🕒 12:30 GMT
🇨🇦 Canada – GDP Month-on-Month
Forecast: 0.0% | Previous: 0.2%
💱 Currency: CAD
🎯 Market mover:
Flat output after prior growth suggested a pause in momentum, important for BoC trajectory and CAD sensitivity.


🕒 13:45 GMT
🇺🇸 United States – Chicago PMI
Forecast: 42.0 | Previous: 40.6
💱 Currency: USD
💡 Why Traders Care:
The regional barometer remained in contraction territory; any improvement historically foreshadowed shifts ahead of ISM manufacturing.


✅ Friday’s calendar remained data-dense, spanning prices, retail demand, and factory sentiment. Markets focused on whether China’s sub-50 PMI, Euro Area disinflation, and cooler U.S. core PCE collectively reinforced a softer global inflation pulse while highlighting uneven growth across regions.

Note: The shutdown may disrupt U.S. government data, leading to possible delays, revisions, or cancellations of scheduled releases.
 

🗓️ High-Impact Economic Calendar – November 3, 2025​

⚡ Monday opened the new trading week with key household and construction data from Australia, fresh factory readings from China, inflation prints from Switzerland, and the U.S. ISM Manufacturing PMI. Together, these indicators provided early insight into global consumption trends, industrial momentum, and underlying price pressures as markets entered November.

Monitoring such releases remained crucial for managing risk and gauging market direction, as PMI and inflation data often triggered volatility across currencies tied to growth and policy expectations.

🕒 Timeline: GMT | 💱 Focused Currencies: AUD, CNY, CHF, USD


🕒 00:30 GMT
🇦🇺 Australia – Household Spending Year-on-Year
Forecast: 5.9% | Previous: 5.0%
💱 Currency: AUD
💡 Why Traders Care:
Stronger spending growth signaled resilient consumer demand despite tightening conditions. A steady pickup reinforced confidence in domestic activity.

🕒 00:30 GMT
🇦🇺 Australia – Building Permits Month-on-Month (Prelim)
Forecast: 6.5% | Previous: -6.0%
💱 Currency: AUD
💬 Market lens:
A sharp rebound in approvals suggested renewed construction momentum after prior weakness, supporting outlooks for housing and employment.


🕒 01:45 GMT
🇨🇳 China – RatingDog Manufacturing PMI
Forecast: 50.8 | Previous: 51.2
💱 Currency: CNY
🎯 Market mover:
A slight dip from prior strength still kept activity in expansion territory. Stability above 50 indicated sustained output despite moderation in new orders.


🕒 07:30 GMT
🇨🇭 Switzerland – Inflation Rate Year-on-Year
Forecast: 0.2% | Previous: 0.2%
💱 Currency: CHF
💡 Why Traders Care:
Flat annual inflation underscored a persistently low-price environment, keeping policy conditions accommodative and CHF movement subdued.

🕒 07:30 GMT
🇨🇭 Switzerland – Inflation Rate Month-on-Month
Forecast: -0.1% | Previous: -0.2%
💱 Currency: CHF
💬 Market lens:
A smaller monthly decline hinted at stabilization in price dynamics after months of softening consumer costs.


🕒 15:00 GMT
🇺🇸 United States – ISM Manufacturing PMI
Forecast: 49.9 | Previous: 49.1
💱 Currency: USD
🔍 Market insight:
A rise toward the 50 threshold signaled an approaching turnaround in U.S. manufacturing. Any move above that level would mark renewed sector expansion.


✅ Monday’s data emphasized consumer and factory resilience despite lingering global headwinds. Traders watched whether Australia’s spending and permits rebound, China’s stable PMI, and the U.S. manufacturing uptick collectively hinted at a modest recovery phase in early November.


The chart below displays USD/CHF on a 15-minute scale following the Swiss inflation release on October 2, 2025, highlighting the pair’s initial reaction and subsequent volatility. It illustrates how a single data point can rapidly shift market sentiment and impact the Swiss franc.


USDCHF.jpg


Switzerland’s Inflation Rate Release - 2 October, 2025

In September 2025, Swiss inflation remained markedly subdued, as consumer prices declined by 0.2% month-over-month and rose just 0.2% year-over-year—well below the Swiss National Bank’s (SNB) target range. Core inflation registered 0.7%, while the Harmonised Index of Consumer Prices (HICP) showed no annual increase, highlighting persistent disinflationary pressures. The decline was broad-based, led by lower prices in travel, accommodation, and transportation services, reflecting weak domestic demand. Against this backdrop, and amid a weakening growth outlook, the data reinforced expectations of further policy easing. With the policy rate already at zero, markets anticipated that the SNB might consider renewed rate cuts into negative territory or expand foreign exchange interventions to curb excessive Swiss franc appreciation. In this context, rate hikes were viewed as unlikely, while the probability of additional monetary accommodation had increased.

Profit Study

The Profit Study below illustrates the required margin and potential profit for this setup, using examples that show how leverage impacts trading outcomes.

At the time of this release, USD/CHF traded at 0.79698

  • If you entered at price of 0.79511, trading 1 standard lot with 1:500 leverage required a margin of $200 USD.
  • At the same open price and 1:2000 leverage, the required margin dropped to $50 USD.
Pip Value (USD/CHF): $12.57703433530374 USD per pip per standard lot.

For example, entering a short at Point A (0.79511) and closing at Point B (0.80000) would have captured 48.9 pips, equivalent to a $615.16 USD profit on one standard lot.

Disclaimer: The content provided is for educational and informational purposes only. This analysis seeks to enhance your understanding of market behavior and highlight potential opportunities that may have existed, offering insights into how the market operates and the possibilities it may present.
 

🗓️ High-Impact Economic Calendar – November 4, 2025​


⚡ Tuesday centered on monetary policy from Australia and labor conditions from New Zealand. The RBA’s cash-rate setting and the NZ unemployment print together shaped views on growth, inflation, and policy paths across Oceania.

Staying ahead of such releases remained crucial, as rate decisions and labor data often sparked swift moves, widened spreads, and altered intraday direction.

🕒 Timeline: GMT | 💱 Focused Currencies: AUD, NZD

🕒 03:30 GMT
🇦🇺 Australia – RBA Interest Rate Decision
Forecast: 3.6% | Previous: 3.6%
💱 Currency: AUD
💡 Why Traders Care:
The cash-rate decision and statement tone set short-term rate expectations and guided AUD volatility. Policy continuity or surprise shifts historically steered yields, swaps, and currency direction.

🕒 21:45 GMT
🇳🇿 New Zealand – Unemployment Rate
Forecast: 5.3% | Previous: 5.2%
💱 Currency: NZD
💬 Market lens:
The jobless rate served as a direct read on slack in the economy. Any rise signaled cooler labor demand and eased pressure on wages, while stability supported consumption resilience.

✅ Tuesday’s calendar stayed concise but high-impact, with the RBA’s stance and New Zealand’s labor snapshot shaping near-term AUD/NZD sentiment and policy expectations.


The chart below displays AUD/USD on a 15-minute scale following the Reserve Bank of Australia’s rate decision on September 30, 2025, capturing the pair’s immediate reaction and the volatility that followed. It highlights how a single policy release can swiftly alter market sentiment and impact the Australian dollar.

AUDUSD Interest Rate RBA.jpg


RBA Interest Rate Decision - 30 September 2025 Release
On 30 September 2025, the Reserve Bank of Australia (RBA) kept the cash rate unchanged at 3.60%, citing persistent inflation risks, a resilient labour market, and stronger-than-expected domestic activity. While inflation had declined since its 2022 peak and remained within the 2–3% target band, recent data—particularly in housing and market services—suggested upward pressure could persist. Private demand, household consumption, and housing activity were recovering, supported by rising real incomes and easing financial conditions. Employment growth had slowed but remained steady, and the unemployment rate held at 4.2%. The Board acknowledged uncertainties in both global and domestic conditions, including the lagging impact of earlier rate cuts and the risk of renewed inflation if consumption and business pricing power strengthened. It emphasized a data-dependent, meeting-by-meeting approach, with no pre-commitment to further easing.

In her post-meeting press conference, Governor Michele Bullock reinforced the RBA’s cautious stance, noting that monetary policy was working as expected but the full effects of earlier cuts were still unfolding. She highlighted that real income gains, wealth effects from rising asset prices, and easing financial conditions were contributing to a lift in consumption. While some upside inflation surprises had emerged, particularly in market services, the RBA remained focused on overall inflation and employment dynamics rather than reacting to month-to-month volatility. Bullock stressed that rate decisions would continue to rely on evolving data, especially as the RBA awaits full monthly CPI reporting beginning in November. Ultimately, the Board maintained a balanced view: while further rate cuts remain possible, a prolonged hold or slower pace of easing may be warranted if inflation proves stickier or demand accelerates more than anticipated. The RBA’s priority remains to keep inflation low and stable while supporting full employment, and it stands ready to act as needed in response to incoming economic conditions.

Profit Study

The Profit Study below illustrates the required margin and potential profit for this setup, using examples that show how leverage impacts trading outcomes.

At the time of this release, AUD/USD traded at 0.65844
  • Entering a long position at 0.65752 with 1 standard lot and 1:500 leverage would require a margin of $131.50 USD.
  • Under the same entry price and lot size, using 1:2000 leverage would reduce the required margin to $32.88 USD.

Pip Value (AUD/USD): $10 USD per pip per standard lot.


For example, entering a long at Point A (0.65752) and closing at Point B (0.66283) would have captured 53.1 pips, equivalent to a $531 USD profit on one standard lot.


Disclaimer: The content provided is for educational and informational purposes only. This analysis seeks to enhance your understanding of market behavior and highlight potential opportunities that may have existed, offering insights into how the market operates and the possibilities it may present.
 

🗓️ High-Impact Economic Calendar – November 5, 2025​

⚡ Wednesday featured European factory and price data alongside key U.S. labor and services prints. Germany’s orders and France’s output gauged industrial momentum, Euro Area PPI tracked pipeline inflation, and the ADP report with ISM Services offered an early read on U.S. employment and demand.

Staying ahead of these releases remained crucial, as surprises in orders, production, and services activity often moved EUR- and USD-pairs within seconds.

🕒 Timeline: GMT | 💱 Focused Currencies: EUR, USD

🕒 07:00 GMT
🇩🇪 Germany – Factory Orders Month-on-Month
Forecast: 1.5% | Previous: -0.8%
💱 Currency: EUR
💡 Why Traders Care:
New orders served as a forward signal for production. A rebound after prior weakness suggested tentative stabilization in Germany’s industrial pipeline.

🕒 07:45 GMT
🇫🇷 France – Industrial Production Month-on-Month
Forecast: 0.5% | Previous: -0.7%
💱 Currency: EUR
💬 Market lens:
A positive print indicated recovering output across key manufacturing segments, supporting the case for an early-quarter activity pickup.

🕒 10:00 GMT
🇪🇺 Euro Area – Producer Price Index Year-on-Year
Forecast: -0.3% | Previous: -0.6%
💱 Currency: EUR
🔍 Market insight:
A smaller annual decline pointed to easing disinflation at the factory gate, shaping expectations for the ECB’s policy path.
🕒 10:00 GMT
🇪🇺 Euro Area – Producer Price Index Month-on-Month
Forecast: -0.3% | Previous: -0.3%
💱 Currency: EUR
🎯 Market mover:
Another negative monthly reading reinforced subdued upstream price pressure despite volatility in energy components.

🕒 13:15 GMT
🇺🇸 United States – ADP Employment Change
Forecast: 20K | Previous: -32K
💱 Currency: USD
💡 Why Traders Care:
Though noisy versus NFP, ADP provided a timely snapshot of private hiring. A modest gain hinted at cautious labor demand.

🕒 15:00 GMT
🇺🇸 United States – ISM Services PMI
Forecast: 50.8 | Previous: 50.0
💱 Currency: USD
💬 Market lens:
A move further above 50 suggested improving services activity—critical given the sector’s outsized share of U.S. GDP and employment.

✅ Wednesday’s calendar balanced European industrial signals with U.S. labor and services momentum. Markets focused on whether a rebound in German orders, firmer French output, and steadier ISM Services offset still-soft Euro Area producer prices.


The chart below displays GBP/USD on a 5-minute timeframe following the U.S. ADP Employment Change release on October 1, 2025, capturing the initial reaction and ensuing volatility to illustrate how a single data point can swiftly influence market sentiment and the U.S. dollar’s direction.

GBPUSD.jpg


ADP Employment Change - 1 October 2025

ADP said U.S. private payrolls fell by 32,000 in September, signaling cautious hiring despite earlier economic strength. A preliminary rebenchmarking cut September’s tally by 43,000 versus pre-benchmarked data and revised August from +54,000 to −3,000. Sector detail showed goods-producing −3k and services −28k, with gains in education/health +33k offset by declines in leisure/hospitality −19k, professional/business services −13k, and financial activities −9k. Regionally, the Midwest −63k led losses, while the Northeast +21k, West +15k, and South +3k saw modest gains. By firm size, small −40k and medium −20k fell, while large +33k rose. Pay growth stayed firm: job-stayers +4.5% YoY and job-changers +6.6%, with ADP noting employers remain cautious.

U.S. manufacturing contracted for a seventh month in September, with the ISM index at 49.1 and new orders falling to 48.9. Despite ongoing weakness in employment, production rose to 51.0 and input prices eased, signaling modest resilience. GBP/USD turned bearish as the stronger-than-expected ISM data eased recession fears and supported the U.S. dollar.

Profit Study

The Profit Study below illustrates the required margin and potential profit for this setup, using examples that show how leverage impacts trading outcomes.
At the time of this release, GBP/USD traded at 1.34728

  • At an open price of 1.34728, trading 1 standard lot with 1:500 leverage required a margin of $269.46 USD.
  • At the same open price and 1:2000 leverage, the required margin dropped to $67.36 USD.

Pip Value (GBP/USD): $10 USD per pip per standard lot.

For example, entering a long at Point A (1.34728) and closing at Point B (1.35273) would have captured 54.5 pips, equivalent to a $545 USD profit on one standard lot.

Disclaimer: The content provided is for educational and informational purposes only. This analysis seeks to enhance your understanding of market behavior and highlight potential opportunities that may have existed, offering insights into how the market operates and the possibilities it may present.
 

🗓️ High-Impact Economic Calendar – November 6, 2025​

⚡ Thursday mixed trade, production, retail, and policy signals across Asia, Europe, and North America. Australia’s trade balance, Germany’s factory output, Euro Area retail sales, the BoE rate call, Canada’s Ivey PMI, and Japan’s household spending together offered a broad read on demand, activity, and policy stances.

Staying ahead of these releases remained crucial, as surprises around trade, retail, and central-bank decisions often moved FX pairs and yields within seconds.

🕒 Timeline: GMT | 💱 Focused Currencies: AUD, EUR, CHF, GBP, CAD, JPY


🕒 00:30 GMT
🇦🇺 Australia – Balance of Trade
Forecast: A$4.0 B | Previous: A$1.825 B
💱 Currency: AUD
💡 Why Traders Care:
A wider surplus pointed to firm commodity exports and positive net trade support for growth, a constructive backdrop for AUD on strong prints.


🕒 07:00 GMT
🇩🇪 Germany – Industrial Production Month-on-Month
Forecast: 2.5% | Previous: -4.3%
💱 Currency: EUR
💬 Market lens:
A rebound after a sharp drop signaled tentative stabilization in manufacturing and construction, key for the Eurozone’s growth engine.


🕒 08:00 GMT
🇨🇭 Switzerland – Unemployment Rate
Forecast: 2.8% | Previous: 2.8%
💱 Currency: CHF
🔍 Market insight:
Stable joblessness underscored tight labor conditions and low domestic slack, typically a calm input for CHF unless deviating from consensus.


🕒 10:00 GMT
🇪🇺 Euro Area – Retail Sales Year-on-Year
Forecast: 1.5% | Previous: 1.0%
💱 Currency: EUR
💡 Why Traders Care:
A firmer annual pace suggested gradual recovery in household demand despite higher rates.

🕒 10:00 GMT
🇪🇺 Euro Area – Retail Sales Month-on-Month
Forecast: 0.2% | Previous: 0.1%
💱 Currency: EUR
🎯 Market mover:
Another positive monthly print reinforced a slow but steady improvement in near-term spending momentum.


🕒 12:00 GMT
🇬🇧 United Kingdom – BoE Interest Rate Decision
Forecast: 4.0% | Previous: 4.0%
💱 Currency: GBP
💬 Market lens:
Rate status and statement tone guided gilt yields and GBP; a steady hold with nuanced guidance typically drove the bigger market reaction.


🕒 15:00 GMT
🇨🇦 Canada – Ivey PMI (SA)
Forecast: 55.0 | Previous: 59.8
💱 Currency: CAD
💡 Why Traders Care:
A moderation from elevated levels still pointed to expanding activity (>50), informing views on demand, hiring, and price pressures.


🕒 23:30 GMT
🇯🇵 Japan – Household Spending Year-on-Year
Forecast: 2.8% | Previous: 2.3%
💱 Currency: JPY
💬 Market lens:
A pickup in real spending hinted at improving consumption dynamics, a key ingredient for Japan’s broader reflation narrative.


✅ Thursday’s calendar balanced Asia’s trade and consumption reads with Europe’s output and retail prints and a key BoE decision. Markets weighed a stronger German rebound and steadier Euro Area retail against policy signals from the BoE and growth cues from Canada’s PMI and Japan’s households.


This 5-minute GBP/USD chart captures the immediate reaction and subsequent volatility after the BoE’s September 18, 2025 rate decision, highlighting how a single release can rapidly shift sentiment and direction in sterling.

GBPUSD.jpg


BoE Interest Rate Decision - 18 September 2025

BoE held Bank Rate at 4.00% with a 7–2 split (Dhingra/Taylor voting for a cut) and slowed the pace of quantitative tightening to £70bn a year from £100bn. That means the Bank will allow fewer gilts to roll off and conduct fewer active sales—an adjustment that reflects caution as reserves approach equilibrium and gilt markets remain sensitive to global term-premium moves. Policymakers repeated that any further easing will be ‘gradual and careful’, while stressing that medium-term inflation risks—especially wage-driven services inflation—remain elevated.

With only one CPI print, one labour report, and limited GDP data before the 6 Nov meeting, plus the late-Nov Budget adding uncertainty, a November cut looks unlikely. Markets still lean toward one 25bp cut by year-end but price only modest odds, leaving real risk easing shifts into early 2026 if wage disinflation stalls. Net takeaway: bias is cautiously dovish, but timing is data-dependent and fragile.

Profit Study

The Profit Study below illustrates the required margin and potential profit for this setup, using examples that show how leverage impacts trading outcomes.

At the time of this release, GBP/USD traded at 1.36494

  • Entering at an open price of 1.36606 with a 1-standard-lot position at 1:500 leverage required a margin of $273.21 USD.
  • At the same open price and 1:2000 leverage, the required margin dropped to $68.30 USD.
Pip Value (GBP/USD): $10 USD per pip per standard lot.

  • Short from Point A (1.36494) → Point C (1.35340): +115.4 pips ≈ +$1,154 USD
  • Short from Point B (1.36606) → Point C (1.35340): +126.6 pips ≈ +$1,266 USD

Disclaimer: The content provided is for educational and informational purposes only. This analysis seeks to enhance your understanding of market behavior and highlight potential opportunities that may have existed, offering insights into how the market operates and the possibilities it may present.
 

🗓️ High-Impact Economic Calendar – November 7, 2025​

⚡ Friday’s calendar featured major trade data from China and Germany, a full Canadian labor report, and preliminary U.S. consumer sentiment. The releases together painted a global picture of trade balances, employment trends, and household confidence at the close of the trading week.

Such cross-regional data often fueled volatility across currencies, as shifts in exports, jobs, and sentiment guided expectations for growth and central-bank outlooks.

🕒 Timeline: GMT | 💱 Focused Currencies: CNY, EUR, CAD, USD


🕒 03:00 GMT
🇨🇳 China – Exports Year-on-Year
Forecast: 7.3% | Previous: 8.3%
💱 Currency: CNY
💡 Why Traders Care:
Export growth signaled sustained external demand. A slower pace still indicated resilience amid global supply pressures and shifting trade patterns.

🕒 03:00 GMT
🇨🇳 China – Balance of Trade
Forecast: $97 B | Previous: $90.45 B
💱 Currency: CNY
💬 Market lens:
A wider surplus highlighted continued export strength relative to imports, supporting CNY stability through stronger trade inflows.

🕒 03:00 GMT
🇨🇳 China – Imports Year-on-Year
Forecast: 7.0% | Previous: 7.4%
💱 Currency: CNY
🎯 Market mover:
Slightly softer import growth pointed to moderated domestic demand but still reflected steady consumption and industrial activity.


🕒 07:00 GMT
🇩🇪 Germany – Balance of Trade
Forecast: €15.6 B | Previous: €17.2 B
💱 Currency: EUR
🔍 Market insight:
A smaller surplus hinted at softer external momentum. Shifts in energy costs and exports to the U.S. and China continued to shape Germany’s trade balance.


🕒 13:30 GMT
🇨🇦 Canada – Full-Time Employment Change
Forecast: -80 K | Previous: 106.1 K
💱 Currency: CAD
💡 Why Traders Care:
Full-time job losses suggested a cooling labor market, often seen as an early signal of slower household spending and wage momentum.

🕒 13:30 GMT
🇨🇦 Canada – Employment Change
Forecast: 5 K | Previous: 60.4 K
💱 Currency: CAD
💬 Market lens:
A modest gain after prior strength showed limited hiring appetite as businesses adjusted to higher borrowing costs.

🕒 13:30 GMT
🇨🇦 Canada – Unemployment Rate
Forecast: 7.2% | Previous: 7.1%
💱 Currency: CAD
🎯 Market mover:
A slight rise in unemployment reinforced signs of labor softening, aligning with the Bank of Canada’s cooling objectives.


🕒 15:00 GMT
🇺🇸 United States – Michigan Consumer Sentiment (Prelim)
Forecast: 53.0 | Previous: 53.6
💱 Currency: USD
💡 Why Traders Care:
Stable sentiment near multi-month lows reflected cautious consumer outlooks on income and inflation, key to assessing future spending patterns.


✅ Friday’s calendar captured slowing but resilient trade flows, cooler Canadian employment, and cautious U.S. sentiment. Markets weighed these signals as evidence of a broadly steady but uneven global growth trajectory heading into mid-November.


This 5-minute USD/CAD chart captures the immediate reaction and subsequent volatility following Canada’s Labour Market Report on October 10, 2025, highlighting how a single data release can rapidly shift sentiment and direction in the CAD.

USDCAD.jpg


Canada’s Labour Data - 10 October 2025

Canada added 60,400 jobs in September 2025, far surpassing expectations for a modest decline, though the unemployment rate held steady at 7.1%. The surprise gain followed significant job losses in July and August, leaving the broader labor market trend subdued, with only 22,000 jobs added year-to-date and continued signs of slack. Full-time employment surged (+106,000), driven largely by public sector and core-aged workers, while part-time jobs declined and youth unemployment rose to 14.7%, the highest since 2010 outside the pandemic. Despite strong hiring in manufacturing, health care, and agriculture, economists caution that the rebound may be temporary and not a sign of sustained recovery. The report complicates expectations for a near-term Bank of Canada rate cut, particularly if upcoming inflation data exceeds forecasts, though persistent labor market slack may still justify easing in the months ahead.

Canada’s stronger-than-expected job gains in September briefly supported the CAD, but persistent labor market slack and a steady 7.1% unemployment rate limited the upside. While the data may delay a rate cut, it didn’t remove the possibility—making the overall impact neutral to slightly bearish for the Canadian dollar. Later, a U.S. Michigan Consumer Sentiment release added mild USD support, helping USD/CAD stabilize and partially rebound.


Profit Study

The Profit Study below illustrates the required margin and potential profit for this setup, using examples that show how leverage impacts trading outcomes.

At the time of this release, USD/CAD traded at 1.40123

  • At an open price of 1.40123, trading 1 standard lot with 1:500 leverage required a margin of $200 USD.
  • At the same open price and 1:2000 leverage, the required margin dropped to $50 USD.

Pip Value (USD/CAD): $7.136739937196689 USD per pip per standard lot.

For example, entering a short position at Point A (1.40123) and closing at Point B (1.39761) would have captured 36.2 pips, equivalent to a $258.35 USD profit on one standard lot.

Disclaimer: The content provided is for educational and informational purposes only. This analysis seeks to enhance your understanding of market behavior and highlight potential opportunities that may have existed, offering insights into how the market operates and the possibilities it may present.
 

🗓️ High-Impact Economic Calendar – November 9, 2025​

⚡ Sunday’s calendar opened the week with China’s latest inflation readings, offering a key snapshot of consumer and producer price trends. Together, the CPI and PPI results provided valuable insight into domestic demand strength and cost pressures within the world’s second-largest economy.

Inflation data are closely watched as early indicators of monetary direction and commodity demand, often influencing CNY and broader risk sentiment across Asia.

🕒 Timeline: GMT | 💱 Focused Currencies: CNY

🕒 01:30 GMT
🇨🇳 China – Inflation Rate Year-on-Year
Forecast: 0.0% | Previous: -0.3%
💱 Currency: CNY
💡 Why Traders Care:
A return toward zero inflation suggested tentative stabilization in consumer prices, hinting that deflationary pressures were easing.
🕒 01:30 GMT
🇨🇳 China – Producer Price Index Year-on-Year
Forecast: -1.9% | Previous: -2.3%
💱 Currency: CNY
💬 Market lens:
A smaller annual decline in factory prices reflected gradual improvement in industrial margins and input cost recovery.
🕒 01:30 GMT
🇨🇳 China – Inflation Rate Month-on-Month
Forecast: -0.1% | Previous: 0.1%
💱 Currency: CNY
🎯 Market mover:
A slight monthly dip underlined weak short-term demand but signaled limited deflation risk if consumer and energy prices stabilized ahead.

✅ Sunday’s early Chinese inflation data highlighted easing producer declines and a near-flat CPI, reinforcing signs that price dynamics were stabilizing after months of softness in Asia’s largest economy.


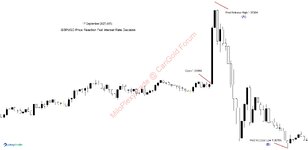
This 5-minute USD/CNH chart illustrates the sharp reaction and ensuing volatility following China’s inflation data release on October 15, 2025, underscoring how a single economic report can swiftly influence market sentiment and direction in the yuan.

USDCNH.jpg


China’s Inflation data - 15 October 2025

In September 2025, China’s consumer prices dropped by 0.3% year-over-year, exceeding expectations and reinforcing ongoing deflation concerns, despite a modest 0.1% monthly rise. Core CPI, which excludes volatile food and energy components, rose by 1%, marking its strongest gain since February 2024 and offering a limited sign of resilience. However, persistent producer price deflation—down 2.3% annually, though easing for a second month—highlights deep-rooted structural challenges including sluggish domestic consumption, intense industrial overcapacity, and prolonged weakness in the property and labor markets. Trade tensions, particularly with the U.S., have added to the strain, with U.S.-bound exports falling sharply and the threat of 100% tariffs casting further uncertainty. While industrial profits improved in August, analysts warn that price stability remains fragile, and without a meaningful recovery in consumer confidence or housing, deflationary pressures are likely to persist.

Despite weak inflation data that would typically pressure the yuan, USDCNH moved lower as the PBOC set the yuan fixing significantly stronger than expected. This official midpoint signaled Beijing’s commitment to stabilizing the currency, leading traders to sell USD against CNH despite ongoing deflationary pressures.

Profit Study

The Profit Study below illustrates the required margin and potential profit for this setup, using examples that show how leverage impacts trading outcomes.

At the time of this release, USD/CNH traded at 7.14136
  • At an open price of 7.14136, trading 1 standard lot with 1:500 leverage required a margin of $200 USD.
  • At the same open price and 1:2000 leverage, the required margin dropped to $50 USD.

Pip Value (USD/CNH): $1.400305266548107 USD per pip per standard lot.

For example, entering a short at Point A (7.14136) and closing at Point B (7.12461) would have captured 167.5 pips, equivalent to a $234.55 USD profit on one standard lot.

Disclaimer: The content provided is for educational and informational purposes only. This analysis seeks to enhance your understanding of market behavior and highlight potential opportunities that may have existed, offering insights into how the market operates and the possibilities it may present.
 
Last edited:

Live Forex Chart

Currency
Rates
EUR / USD
1.14492
USD / JPY
157.384
GBP / USD
1.33428
USD / CHF
0.82033
USD / CAD
1.40611
EUR / JPY
180.192
AUD / USD
0.71175
Back
Top
Log in Register