BTC USD 63,695.2 Gold USD 2,383.57
Time now: Jun 1, 12:00 AM

Forex Trading Ideas

Chartreaderpro

Freshie
Messages
26
Joined
Apr 1, 2018
Messages
26
Reaction score
0
Points
3
We will try to share detailed forex trading ideas.

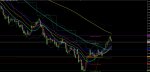
The first one is EURUSD

We are going to have a quiet trading day as Europe remains closed.

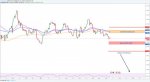
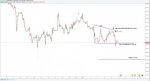
The pair is still under Bearish pressure. It is below EMA 50, EMA 100 and EMA 200 of H4 Chart Timeframe.

1.23100 and 1.22980 are the next downside levels of today.

The real problem for Euro Bulls will start if it breaks below 1.22980. 1.22680 and 1.22300 will be the next targets of the pair and it will not take too much time to achieve those levels.

1.23600 remains as the main resistance and bearish pressure will continue as long as the price stays below 1.23600.

Bulls may come back to the playground after an H4 closing above 1.23600.

Since we are going to see low volumes today, the best strategy can be “wait and see. ” Or short with a stop loss above 1.23600. – We suggest you try shorts with small lots- 1.22980 1.22830 and 1.22680 are take profit levels.

EURUSD.png
 
Sponsored Post

EURUSD Technical Overview And Key Levels 04-06-2018

EURUSD Technical Overview And Key Levels 04-06-2018

Asia Overview by Reuters:

The dollar index was down 0.1 percent at 90.359. The index has risen 0.4 percent this week.

Treasury debt prices gained and yields declined as investors sought the safety of government bonds.The 10-year Treasury note yield fell 2 basis points to 2.811 percent, pulling back from Thursday’s nine-day high of 2.838 percent.

Trump said late on Thursday that he had instructed U.S. trade officials to consider $100 billion in additional tariffs on China, fuelling the trade dispute between the world’s two economic superpower

Traders are focused on NFP. Considering USD’s recent strength, investors are positioning for a stronger labour-market number but there’s also plenty of room (in wage growth and the jobless rate) for a downside surprise, which makes trading NFP this month particularly difficult.

Technical Analysis and Key Levels:

We have published our trade set up before. Our short position has reached the first target and still running.

https://www.tradingview.com/chart/EURUSD/9iEbyg1r-EURUSD-Simply-Short/

One of the main scenarios was a bullish shark formation as described in the following chart.

Technical Key Levels:

We want to keep it simple for you. As shown in the H4 Chart:

EURUSD is below EMA 50, 100 and EMA 200. Golden Cross is very close. RSI is oversold. However, in the daily chart, RSI has room downside.

The main resistance zone – orange coloured- is 1.23000 – 1.23300. Above the resistance zone, 1.23600 will be the key level for the continuation of the upside move.

Below the current level, 1.22080 – 1.21780 ( Red Coloured ) zone is the main support. Break below this support will carry the price 1.21090 – 1.20900.

1.20900 was the breakout of the bullish triangle. 450 pips bullish move had started after the breakout of 120900. This level is likely to play a key support role. If EURUSD breaks below 1.20900, we can start to speak about a trend reversal and 1.17000.

DISCLAIMER: This is a technical analysis study, not an advice or recommendation to invest money
 

Attachments

WTI Crude Oil Technical Analysis And Trade Idea

WTI Crude Oil Technical Analysis And Trade Idea

Published 05-04-2018

We have published a detailed analysis on Monday.

The fundamental side is mixed. Iran Nuclear Agreement in May might be the determining factor in Crude Oil Prices.

On the Technical side, the price is above the EMA 50. However, H4 chart indicators and oscillators started to send bearish signals.

We have a bearish flag formation. If the price breaks below 62.50 support, 62.20 -62.00 interval will be the key levels.

Break and H4 closing below 62.20, would validate the bearish flag pattern. The target of the formation is 58-40-58.20. This level is one of the historical levels as well.

We will keep updated the premium members as soon as the pattern is validated.

DISCLAIMER: This is a technical analysis study, not an advice or recommendation to invest money on.

Visit our web for more detailed for cast and technical analysis
 

Attachments

XAUUSD Gold Forecast And Technical Levels 04-06-2018

The main idea: We are still bullish midterm.

Yesterday we have published a trading idea based on the bearish triangle breakout.

http://chartreaderpro.com/xauusd-gold-triangle-pattern-short-opportunity/

We see a bullish Gartley pattern forming and would be completed at 1.308-1.312.

We look for fresh buy opportunities and will update premium members.

Fundamentally:

NFP reports will be released today. It is obvious that we will see the temporary effects of the reports.

However, midterm, Gold prices are expected to rise as mining exploration struggles to find enough new discoveries to add to the global reserves

Gold prices rose on Friday as investors sought safer assets after U.S. President Donald Trump proposed $100 billion in new tariffs on China, raising concerns about an escalating trade spat between the United States and China.

Technically:

On the daily chart, XAUUSD moving in an ascending channel. Price is above EMA 100 and EMA 200.

1328 is the EMA 50 and MM 2/8 Major Reverse and Support. We have mentioned this key level before.

However, on the H4 chart, we see that the price is below EMA 50, 100 and 200. Gold is trading in the lower Bollinger Band. The picture is bearish. We need to see a few H4 closing above 1328 for the continuation of the bullish move.

We have given some key levels yesterday. 1324, 1320, 1316, and 1312.

If the price breaks below 1324, 1320 will be tested for sure. And below 1320, 1316 and 1312 will be on the target.

We will update as soon as we see the fresh buying opportunity.

DISCLAIMER: This is a technical analysis study, not an advice or recommendation to invest money
 

Attachments

CHFJPY Bearish Cypher and Trend Line Breakout Update:

Bearish Cypher Harmonic Pattern would be completed at 111.740.

A broken inverted SHS and trend line resistance at the same level.

We may see a retracement towards 111.500 111.350.

On the other hand; break above the trend line will carry the price 112.400 and 112.700.

I will try short at 111.750 Stop Loss 112.030. Targets 111.500 and 111.350

If the price breaks above the trend line we will be stoped out. However, in this case, the price is likely to retest the trendline and I will enter LONG at the retest level.

Update: Short Trade reached the first target. At the second target, we will close the short positions.

We will update the idea this weekend.

You can follow the trade :

http://chartreaderpro.com/chfjpy-bearish-cypher-trend-line-breakout/
 

Attachments

Attachments

GBPUSD Forecast and Technical Analysis Week 09-13 April

GBPUSD Forecast and Technical Analysis Week 09-13 April

Before the forecast and technical analysis, I would like to take a look at our latest trade ideas.

We have a long trade based on Bullish Butterfly and we have reached the first target @ 1.40800.

http://chartreaderpro.com/gbpusd-potential-long-opportunity-harmonic-trading/

And Long Trade based on Bullish CwH to add long for ISHS pattern.

https://www.tradingview.com/chart/GBPUSD/3BZ8KQ3l-GBPUSD-Where-and-When-to-add-Long/

Now, let us take a look at the fundamentals:

NFP report was highly disappointing. However, I do not think that would make a too much negative effect on US Dollar. Subsequently, the US unemployment rate also dwelled at the unchanged level of 4.1% instead of falling lower to 4.0% as expected by the market.

The weak UK PMIs did not help Cable to fall below 1.39600. Market players are expecting further rate hikes from BoE as we mentioned in our previous forecast.

The main topic haunting the financial markets was the ongoing trade wars between the US and China.

Technically:

The main trend is still bullish.
On the Daily Chart, the price is above EMA 50,100 and 200.

1.39600 is EMA 50 support of the Daily Chart. That’s why we pay attention to this level. The midterm bullish trend will continue as long as the price holds above 1.39600.

1.42500 as EMA 100 of the weekly chart, acts as a resistance. We can see the price is “locked ” between 1.39600 – 1.42500 – almost 300 pips –

On the H4 Chart: – To see the intraday levels –
1.41000 is the key level for the continuation of the bullish move. If the price breaks above 1.41000, Cable is likely to test 1.41280 and 1.41600.

Below the current level; 1.40800 and 1.40600 are the first levels to test. 1.40380 is the key support. Break below 1.40380 will carry the price 1.40000 and 1.39600 again.

DISCLAIMER: This is a technical analysis study, not an advice or recommendation to invest money
 

Attachments

XAUUSD Gold Overview and Technical Analysis

XAUUSD Gold Overview and Technical Analysis

Published 04-15-2018

Gold made several failed breakout attempts since its multi-year high reached in 2016. We see that the gold prices are still in a solid uptrend, creating higher lows along the way.

That is true: The market is struggling, but it looks like it wants to grind higher

Geopolitical instability will continue to support gold as a safe-haven asset.

Fundamentally, we do not see any logical reason to sell GOLD.

As we have mentioned in our previous forecasts, we remain bullish. Our first midterm target was 1361 and it was tested last week.

Our Next Target is 1375 as seen in the chart. A bullish flag formation is forming as well.

We just need a daily closing above 1360. The real bullish game will start as soon as XAUUSD makes a daily closing above 1360.

Our Midterm Targets: 1375, 1408, 1440 and 1476 ( The target of the bullish flag formation )

BUY GOLD and FORGET.

USE PULLBACKS AS BUYING OPPORTUNITIES.

Pullback Levels To Buy: 1335 1328 1324

The fresh GOLD trade setup will be published for premium members.

DISCLAIMER: This is a technical analysis study, not an advice or recommendation to invest money
 

Attachments

GBPUSD Futures : Shall the Bulls unlock the pasword?

Todays’s UK PMI data – 54 announced vs. Market Expectation 52.9 – gave the Sterling a boost in the short term.

However, the major problem to be solved is still Brexit.

When we look technically

Critical support for the party, which has maintained 1.46 targeted SHS support in the long run despite the sharp fall, is at 1.31 level.

Details of the forecast and trade idea:

http://chartreaderpro.com/gbpusd-futures-shall-bulls-unlock-pasword/
 

Attachments

EURUSD Forecast And Technical Analysis 06-08-2018

On the Euro side, Italy is still a risk for investors. The market’s attention is focused on next week’s ECB meeting. Fundamentally there was nothing to boost to push EURUSD higher.

On the Dollar side, USD has lost its charm as Trump protectionism announcements are triggering countermeasures from multiple fronts that will end up weighing on economic progress in the world’s largest economy. And the economic figures are not promising, and doubts occurred about the further rate hikes.

There is no strong data flow today. German Industrial Production and Trade Balance will be released.

The pair has tested 1.18400 which is the Fibonacci 38.20% major resistance. As seen on the H4 chart timeframe 1.18400 is the extremely overshoot level of MM Lines and EMA 200 resistance

Continue Reading
 

Attachments

Sponsored Post

Live Forex Chart

Currency
Rates
EUR / USD
1.06638
USD / JPY
154.594
GBP / USD
1.24642
USD / CHF
0.91145
USD / CAD
1.37503
EUR / JPY
164.856
AUD / USD
0.64410

CG Sponsors


Back
Top
Log in Register