BTC USD 63,507.6 Gold USD 2,386.95
Time now: Jun 1, 12:00 AM

Crypto Analysis Bitcoin : Daily Technical And Fundamental Analysis By INSTAFOREX

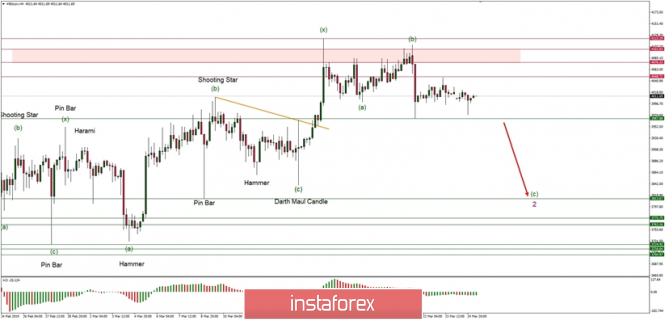
BITCOIN Analysis for March 25, 2019

Bitcoin has been struggling and consolidating at the edge of $4,000 after impulsive bearish pressure observed recently which aroused after the rejection off the $4,100 area. Though the bearish pressure was very impulsive, it failed to sustain the impulsive bearish momentum to push the price even lower.

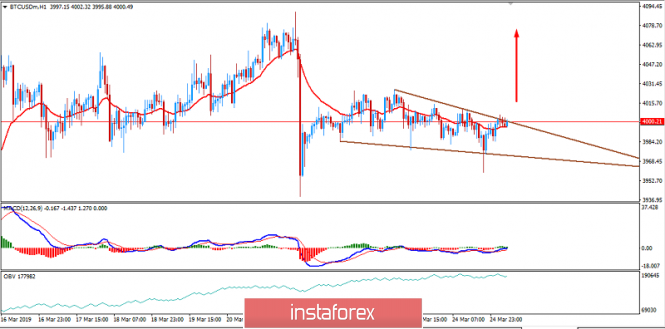
The price recently formed a downward sloping triangle. If the pattern is broken, a further step will be to break above $4,000. This will lead the price higher towards $4,250 in the coming days.

The volatility is still quite high in Bitcoin. However, the price is likely to create a clear path to progress higher after a breakout above this corrective structure. As the price remains above $3,800-80 support area, the bullish bias is expected to continue further.
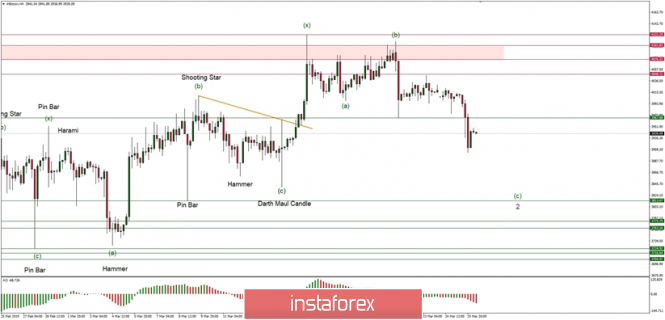
SUPPORT: 3,500-600, 3,800-80

RESISTANCE: 4,000, 4,250, 4,500

BIAS: BULLISH

MOMENTUM: VOLATILE

analytics5c9879d6364ff.png
 
Sponsored Post

Bitcoin Elliott Wave analysis for 25/03/2019

Technical market overview:

The BTC/USD pair has been slowly trading inside of the narrow horizontal zone located between the levels of $3,967 - $4,048 with a little downside bias. The momentum remains weak and negative with clearly supports the current wave scenario of this pair, in which there is a missing sub-wave (c) in the wave 2 of a higher degree. The target level for wave 2 is way below the current price, at $3,813 and any violation of the level of $3,967 will be a first sigh that the sub-wave (c) continues to unfold.

Weekly Pivot Points:

WR3 - $4,204

WR2 - $4,154

WR1 - $4,072

Weekly Pivot - $4,017

WS1 - $3,925

WS2 - $3,867

WS3 - $3,781

Trading recommendations:

The market is still unfolding the wave (c) to the downside, so according to this bias only sell orders should be opened on every upwards correction up to the level of $4,048. The targets ( take profit levels) are seen at the levels of $3,967 and way lower at $3,813.

analytics5c9879d6d8bd0.jpg
 
Bitcoin Elliott Wave analysis for 26/03/2019

Technical market overview:

The BTC/USD pair has moved lower as anticipated and the local low was made at the level of $3,909. The momentum remains weak and negative with clearly supports the current wave scenario of this pair, in which there is a missing sub-wave (c) in the wave 2 of a higher degree.

The target level for wave 2 is way below the current price, at $3,813 and any violation of the level of $3,967 will be a first sigh that the sub-wave (c) continues to unfold.

Weekly Pivot Points:

WR3 - $4,204 WR2 - $4,154 WR1 - $4,072

Weekly Pivot -

$4,017 WS1 - $3,925 WS2 - $3,867 WS3 - $3,781

Trading recommendations:

The market is still unfolding the wave (c) to the downside, so according to this bias only sell orders should be kept open.

The targets ( take profit levels) are seen at the levels of $3,967 and way lower at $3,813.

analytics5c99ce6213d5c.jpg
 
Bitcoin Elliott Wave analysis for 29/03/2019

Technical market overview:

The BTC/USD pair has again attempted to move up and break through the technical resistance zone located between the levels o f$4,076 - $4, 104, but so far failed to do so.

Nevertheless, the bulls are still trying despite the last candle signal that looks like a Shooting Star. If they manage to break out higher, then the next immediate target is sth top for the wave (x) at the level of $4,122.

Weekly Pivot Points:

WR3 - $4,204 WR2 - $4,154 WR1 - $4,072

Weekly Pivot - $4,017

WS1 - $3,925 WS2 - $3,867 WS3 - $3,781

Trading recommendations:

There is another good trading setup for bears: opening sell orders in the area of $4,077 - $4,104 with a protective stop loss just above the level of $4,122.

The take profit level will remain open for now, but the first one would be seen at the level of $3,967.
 
Sponsored Post

CG Sponsors


Back
Top
Log in Register