BTC USD 63,482.8 Gold USD 2,378.88
Time now: Jun 1, 12:00 AM

GOLD AND USDX : Daily Signal And Analysis From InstaForex

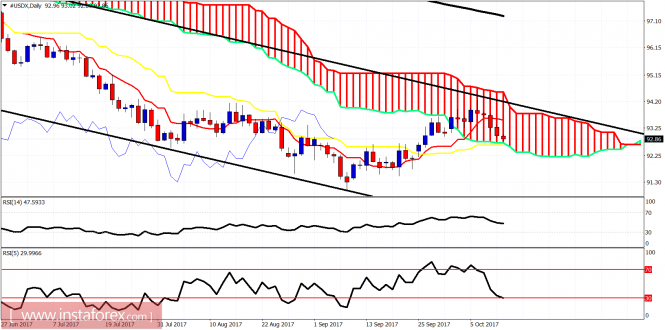
The dollar has prospects for growth

Extremely weak data on the number of new jobs did not put pressure on the US dollar. In point of fact, the number of new jobs in the United States was expected by everyone in the market to decline. But the American economy was not expected to acquire any of them and even lost it. According to the data provided by the Ministry of Labor, the number of new jobs in the non-agricultural sector of the economy fell by 33,000 in September against the median forecast of growth by 90,000. At the same time, the unemployment rate fell to 4.2% from 4.4%, the values from the beginning of "zero".

But, strangely enough, these figures did not shock the market participants, as everyone understood that the emergency situation in the southern states of the country, as well as on the islands, would lead to a drop in business activity and to the temporary closure of many firms, resulting to a skew in the incoming statistics . It is likely that the October values in the number of new jobs under the non-agricultural sector of the economy will show the strongest growth, as it has repeatedly occurred earlier in periods of harsh and snowy winters in Northern America.

If the markets did not actually react to the labor market statistics, then they quickly responded to the publication of data which is the stronger increase of average wage rate by 0.5% Instead of the expected value of 0.3% and the increase of 0.2% in August. These data significantly increased the expectations of December growth rates from the Fed. According to the data on federal funds future rates, the probability of another rate increase in December by 0.25% to 1.50% has increased to 91.7%. Hence, market players are absolutely certain that the rates will be raised.

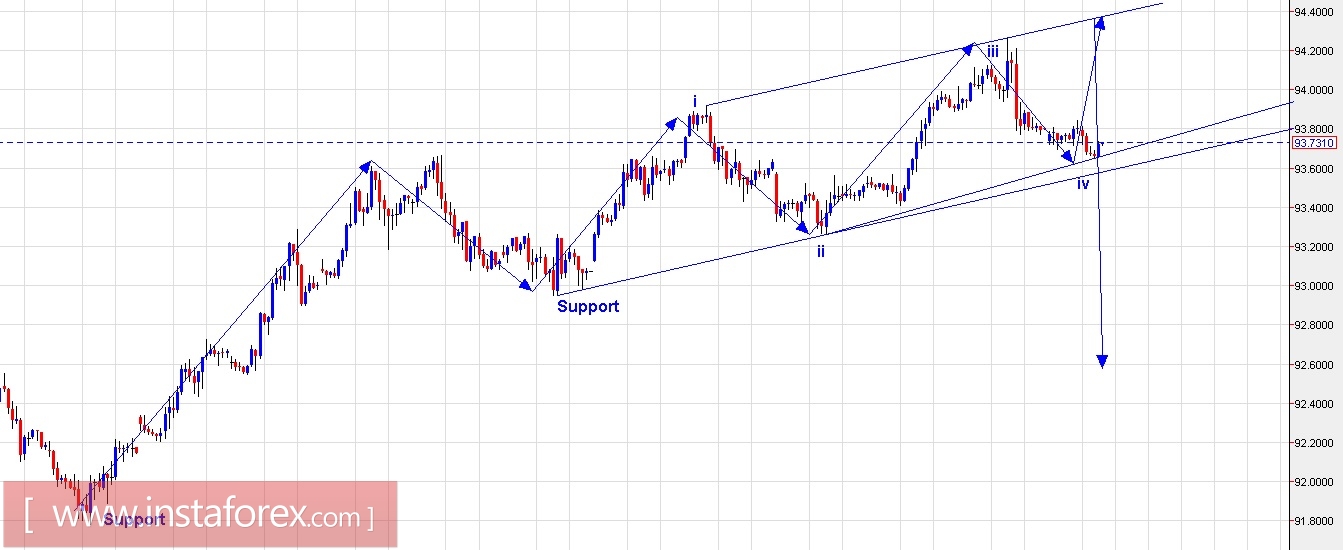
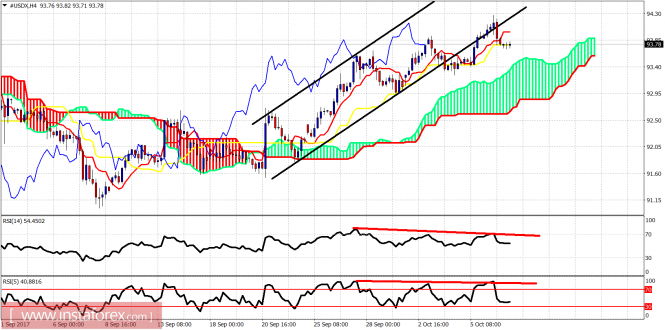
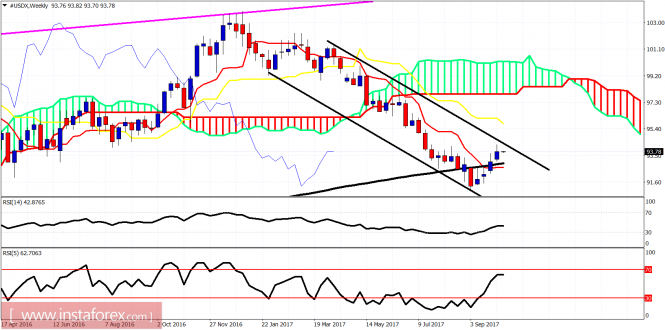
Evaluating this situation, we can assume that if something does not happen uncontrollably, then the US dollar will continue to smoothly strengthen against the major currencies after some weak correction.
 
Sponsored Post

Trading Plan for US Dollar Index for October 09, 2017


Technical outlook:

The US Dollar Index has been consistently forming higher highs and higher lows since printing lows at 91.00 levels back in September 2017. Besides, its uptrend channel support trend line remains well intact without breaking below any lows as well. Looking at the recent wave pattern, the US Dollar Index might be producing a potential ending diagonal structure and could be into its last leg rally, which could push through 94.50 levels.

If this wave count holds to be true, the index would stay above 93.25 levels and look to push through its channel resistance line which is seen passing through 94.40/50 levels for now. On the flip side, a drop below 93.25 levels would indicate an intermediate top is in place and that prices should look to retrace lower. Immediate support is at 93.25 while resistance is seen at 94.40/50 levels respectively.

Trading plan:

Immediate short term, please remain long with risk below 93.25 and target 94.40/50

Medium term strategy would be to remain flat for now and look to sell higher at 94.40/50

Fundamental outlook:

No major events are lined up for the rest of the day.
 
Market Snapshot: Gold bounces from 61%Fibo level

The price of Gold had bounced from 61%Fibo at the level of $1,263 and currently is testing the broken golden trend line from above. The upward momentum remains strong, but the key level to the upside is still at $1,300 and as long as the price remains below this level, the bias is still to the downside.

 
Ichimoku indicator analysis of USDX for October 9, 2017
The Dollar index is showing reversal signs of the daily Ichimoku cloud resistance at 94. Price remains inside the bearish channel however we do not have a confirmation that a new downward move has started.

analytics59db1f0129798.png


Black lines - bullish channel

Red lines - bearish divergence signs

The Dollar index continues to trade above the 4-hour Kumo (cloud) support. Trend remains bullish as price is making higher highs and higher lows. However there are several warning signs justifying a full-scale reversal. Both RSI are diverging. Price has broken below the bullish channel. Price is at important resistance.

analytics59db1f5fcdda1.png


Black lines - bearish channel

On a weekly basis price remains inside the bearish channel. Price has reached the upper channel boundary and is showing signs of rejection. However only a break below 93 would confirm the bigger reversal in prices. My view is that we will see that reversal materialize.
 
Technical analysis of gold for October 09, 2017

Gold price is trading higher after the reversal on Friday. We have been warning Gold bears that the bullish divergence signs combined with the important support of 61.8% Fibo at $1,260 justified a strong bounce. However we do not see this as just a bounce but the start of a bigger move higher.

analytics59db1d7197383.jpg


Black line - resistance (broken)

Red line - resistance (broken)

Gold price has made an important low at $1,260. I believe we have started the next leg up towards $1,400. I'm very bullish Gold. Short-term support is now at $1,272. Resistance is at $1,293 and next at $1,316. Breaking above these levels will open up the way towards $1,350-75.

analytics59db1e1e0a6ba.jpg


Long lower tail in the weekly candle of Gold price bouncing off the 61.8% Fibonacci retracement of the rise from $1,205 to $1,356. This candlestick formation is considered a bullish reversal signal specially if this week's candle is also bullish.
 
Analysis of Gold for October 10, 2017


Recently, the Gold has been trading upwards. The price tested the level of $1.292.90. According to the 15M time – frame, I found a rising wedge in creation, which is a sign that buying looks risky. My advice is to watch for potential selling opportunities if the price breaks the support of the pattern ($1,290.00). I also found a hidden bearish divergence on the moving average oscillator, which is another sign of weakness. The downward target is set at the price of $2,***.30 (pattern projection).

Resistance levels: R1: $1,292.60 R2: $1,294.40 R3: $1,296.30

Support levels: S1: $1,288.90 S2: $1,286.55 S3: $1,285.00

Trading recommendations for today: watch for potential selling opportunities.
 
Market Snapshot: Gold at 38%Fibo

The price of Gold has retraced 38% of the previous swing down and it is currently trading at the level of $1,297 in overbought market conditions. There is a visible bearish divergence between the price and the momentum oscillator which supports the bearish short-term outlook.

 
Daily analysis of Gold for October 12, 2017


Overview

Gold price has been showing calm upward trading to approach the first waited target at $1,299.20, keeping the bullish trend scenario valid until now. It is supported by the EMA50 that carries the price from below. Please note that breaching the mentioned level is required to push the price towards $1,321.49 as the next upward target. Stochastic is showing bullish signals that support the chances of extending the bullish wave in the short term. Let me remind you that holding above 1281.17 represents the key condition to continue the expected rise. The expected trading range for today is between $1,281.00 support and $1,310.00 resistance.
 
Analysis of Gold for October 12, 2017


Recently, Gold has been trading upwards. The price tested the level of $1,297.50. According to the 15M time - frame, I found a successful testing of solid support at the price of $1,294.00, which is a sign that selling looks risky. The ADX indicator is above 30 level, which means that buyers are in control. My advice is to watch for potential buying opportuntiies. Upwards targets are set at the price of $1,297.50, 1,299.70 and $1,305.00.

Resistance levels: R1: $1,298.25 R2: $1,301.60 R3: $1,307.35

Support levels: S1: $1,289.15 S2: $1,283.40 S3: $1,280.00

Trading recommendations for today: watch for potential buying opportunities.

Read more: https://www.instaforex.com/forex_analysis/101111
 
Ichimoku indicator analysis of USDX for October 12, 2017

The Dollar index as expected has made a full-scale reversal since last Friday when we expected for the Dollar to top. Price has broken through cloud support in the short term and is making lower lows and lower highs. Trend is bearish.

analytics59df159d6944e.png


Black rectangle - support (broken)

Yellow rectangle - resistance

The Dollar index has broken below the Ichimoku cloud in the 4-hour chart. Price has moved lower as expected when we were trading around 94. Price justifies a bounce soon but it is important to see if this bounce makes a lower high and gets rejected by the Kumo (cloud) resistance.

analytics59df15fad0d28.png


Black lines - bearish channel

The rejection at the upper channel boundary is unfolding. Price has now reached the lower cloud boundary and the kijun-sen indicator (yellow line). This is important support area for the Dollar index. Price could bounce from this area. As long as we are trading inside the bearish channel, I will continue to be bearish expecting new lows in the Dollar index.
 
Sponsored Post

Live Forex Chart

Currency
Rates
EUR / USD
1.06425
USD / JPY
154.665
GBP / USD
1.24372
USD / CHF
0.91227
USD / CAD
1.37715
EUR / JPY
164.602
AUD / USD
0.64204

CG Sponsors


Back
Top
Log in Register