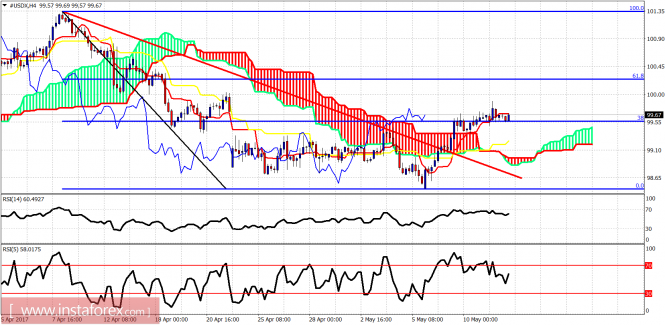
Ichimoku indicator analysis of USDX for May 12, 2017
The Dollar index is trading sideways. Price is still around the 38% Fibonacci resistance area, while the oscillators work off the overbought signals. We could see a pullback to 99 before more upside.
Red line - resistance (broken)
Price is trading above the 4-hour Kumo but below the tenkan-sen (red line indicator). We could see a pullback towards the cloud support at 99 before continuing the uptrend. Currently I expect price to move lower and test support.
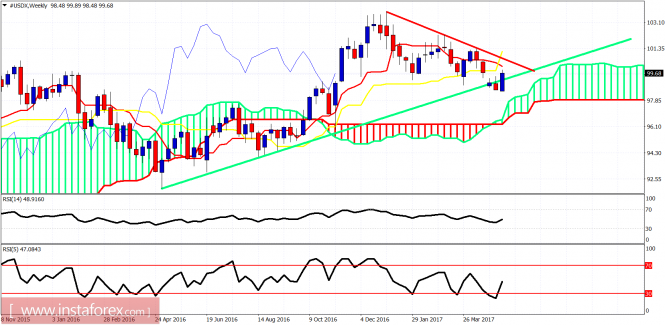
Red line - resistance
Green line - long-term support trend line
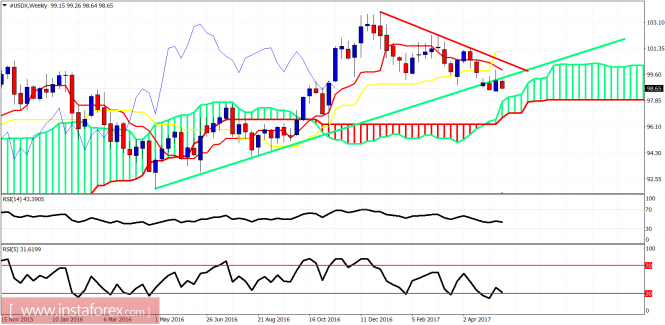
The Dollar index is testing weekly kijun- and tenkan-sen resistance. Price is below the important red trend line resistance but has also moved back above the long-term support trend line. The index is at a critical junction. Breaking to a new weekly low will be very bearish for the Dollar.
Ichimoku indicator analysis of USDX for May 12, 2017
The Dollar index is trading sideways. Price is still around the 38% Fibonacci resistance area, while the oscillators work off the overbought signals. We could see a pullback to 99 before more upside.
Red line - resistance (broken) Price is trading above the 4-hour Kumo but below the tenkan-sen (red line indicator). We could see a pullback towards the cloud support at 99 before continuing the uptrend. Currently I expect price to move lower and test support.
Red line - resistance Green line - long-term support trend line The Dollar index is testing weekly kijun- and tenkan-sen resistance. Price is below the important red trend line resistance but has also moved back above the long-term support trend line. The index is at a critical junction. Breaking to a new weekly low will be very bearish for the Dollar.
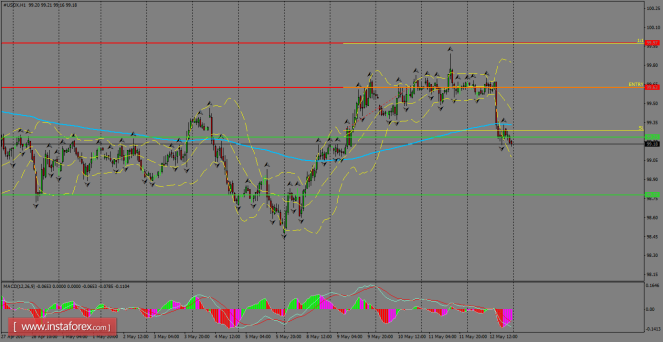
USDX is piercing the support level of 99.23, which means a further consolidation below the 200 SMA on H1 chart. However, the overall picture remains bullish, as long as the index holds the lows from May 8th.
The current move should be taken as a corrective one in favor of the bulls, but a continuation lower can produce a decline to test the 98.77 level. To the upside, the key resistance is at the 99.63 level.
H1 chart's resistance levels: 99.63 / 99.97
H1 chart's support levels: 99.23 / 98.77
Trading recommendations for today:
Based on the H1 chart, place buy (long) orders only if the USD Index breaks with a bullish candlestick; the resistance level is at 99.63, take profit is at 99.97 and stop loss is at 99.28.
The Dollar index is following our path. Price bounced off the 98.60 area and found resistance and got rejected at 99.60 area. Our first target for a pullback was at the 99 level where we are right now. If the Dollar index is to reverse upwards, it needs to do it early this week and not move much lower.
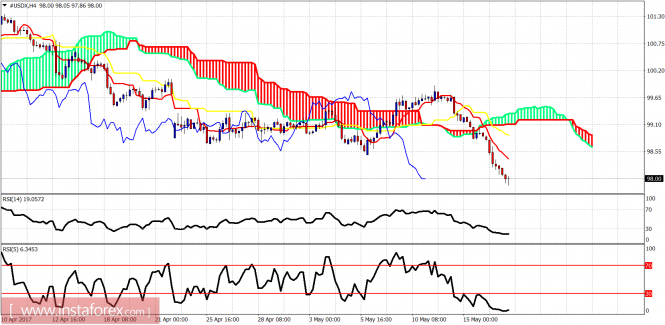
Red line - resistance (broken) The Dollar index is still trading above the Ichimoku cloud on the 4-hour chart and is now testing important short-term support. The Dollar index should bounce from current levels, otherwise we should expect the test of May lows and why not break below them as last week we did not manage to close above weekly support.
Red line - resistance Green line - long-term support The Dollar index weekly candle of last week did not manage to close above the long-term green trend line support. Price is now trading below the trend line which is now resistance. The most important however resistance is the downward sloping red trend line at 100.50. Weekly support is now at 98 where the Kumo (cloud) is found.
USDX is piercing the support level of 99.23, which means a further consolidation below the 200 SMA on H1 chart. However, the overall picture remains bullish, as long as the index holds the lows from May 8th. The current move should be taken as a corrective one in favor of the bulls, but a continuation lower can produce a decline to test the 98.77 level. To the upside, the key resistance is at the 99.63 level.
H1 chart's resistance levels: 99.63 / 99.97 H1 chart's support levels: 99.23 / 98.77 Trading recommendations for today: Based on the H1 chart, place buy (long) orders only if the USD Index breaks with a bullish candlestick; the resistance level is at 99.63, take profit is at 99.97 and stop loss is at 99.28.
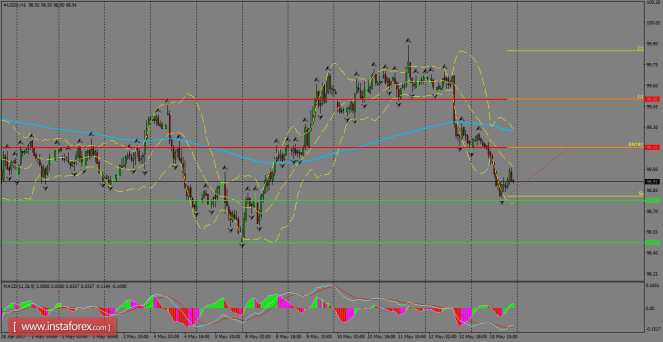
The index is extending losses below the 200 SMA on the H1 chart and is trying to invalidate the bullish outlook that we've been managing since last week. So far, USDX has been approaching the support level of 98.77, where a breakout should open the doors to test the 98.47 zone. However, as this move can be still considered as corrective, we can expect further rebounds to re-test the 200 SMA.
H1 chart's resistance levels: 99.15 / 99.50 H1 chart's support levels: 98.77 / 98.47 Trading recommendations for today: Based on the H1 chart, place buy (long) orders only if the USD index breaks with a bullish candlestick; the resistance level lies at 99.15, take profit is found at 99.50 and stop loss is at 98.81.
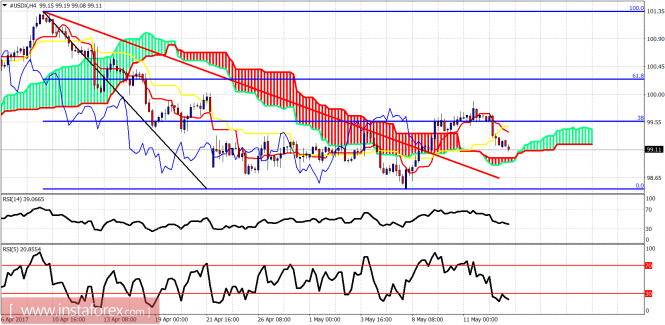
Ichimoku indicator analysis of USDX for May 16, 2017
The US dollar index did not bounce yesterday and broke through the support. The last chance for dollar bulls is to make a double bottom at 98 and then bounce. The weekly trend line is broken and dollar bulls need to show more strength if they want the trend to reverse to the upside.
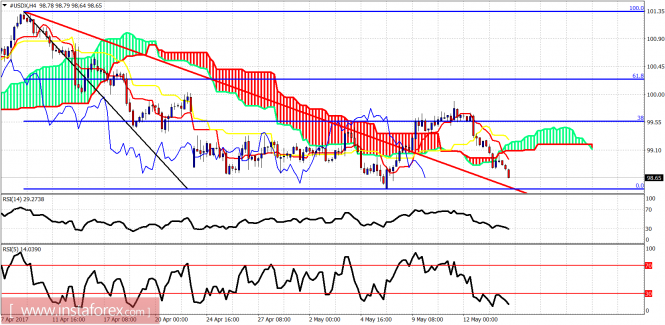
Red line - resistance (broken) The dollar index has broken below the 4 hour cloud. The price could be back testing the red trend line resistance that was broken. Support lies at the May lows at 98.48 and we could see a double bottom here. If the support fails to be broken, we should expect 98 to be tested and most probably broken.
Red line - resistance Green line - long-term support trend line The Dollar index broke below and back-tested the green trend line resistance. Price tried to move above it again but got rejected. USDX may move towards the weekly Kumo support at 97.80-97.50. This is my next target from where we could see a considerable bounce in the index.
Ichimoku indicator analysis of USDX for May 17, 2017
The Dollar index remains in a bearish trend breaking to new lows as each level of support we mentioned failed to hold. Price is now heading towards our second target of 97.50-97.
A few days back I mentioned that the USDX should bounce from 99 otherwise we will see 98.50 being tested and most probably broken. The bearish scenario came through and support at 98.50 failed to hold.
Price is now making new lows. Trend is bearish. Bulls did not manage to reverse the trend and break resistance.
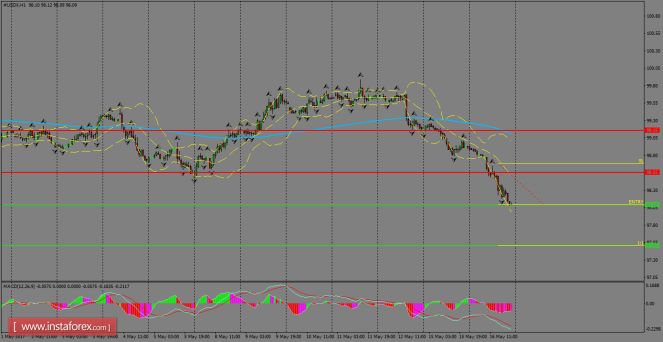
Red line - resistance
Green line - long-term trend line support
As mentioned earlier this week the weekly candle could manage to get back above the long-term green trend line support and got rejected. A move towards the weekly Kumo at 97 was expected. This is now what we get.
Price is now testing the upper cloud boundary at 97.50-97. This is strong weekly support.
USDX had a strong decline on Tuesday and it's consolidating well below the 98.20 level. The support zone of 98.08 is now the area where buyers will try to correct the recent decline. If that level gives up, then we can expect a downside acceleration towards the 97.50 level. However, if the corrective move happens, the resistance zone of 98.55 is a feasible target to the upside.
H1 chart's resistance levels: 98.55 / 99.15 H1 chart's support levels: 98.08 / 97.50 Trading recommendations for today: Based on the H1 chart, place sell (short) orders only if the USD Index breaks with a bearish candlestick; the support level is at 99.15, take profit is at 99.50 and stop loss is at 98.81.
Ichimoku indicator analysis of USDX for May 17, 2017
The Dollar index remains in a bearish trend breaking to new lows as each level of support we mentioned failed to hold. Price is now heading towards our second target of 97.50-97.
A few days back I mentioned that the USDX should bounce from 99 otherwise we will see 98.50 being tested and most probably broken. The bearish scenario came through and support at 98.50 failed to hold. Price is now making new lows. Trend is bearish. Bulls did not manage to reverse the trend and break resistance.
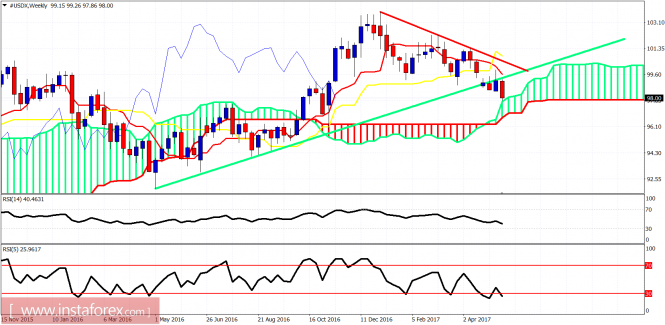
Red line - resistance Green line - long-term trend line support As mentioned earlier this week the weekly candle could manage to get back above the long-term green trend line support and got rejected. A move towards the weekly Kumo at 97 was expected. This is now what we get. Price is now testing the upper cloud boundary at 97.50-97. This is strong weekly support.