BTC USD 63,551.9 Gold USD 2,388.72
Time now: Jun 1, 12:00 AM

Daily technical analysis of GOLD By INSTAFOREX

Status
Not open for further replies.
Overview
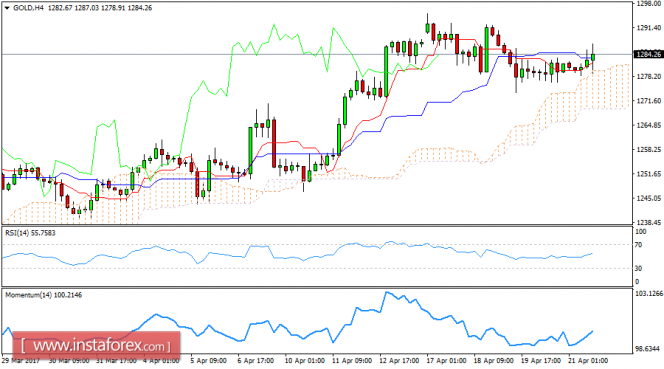
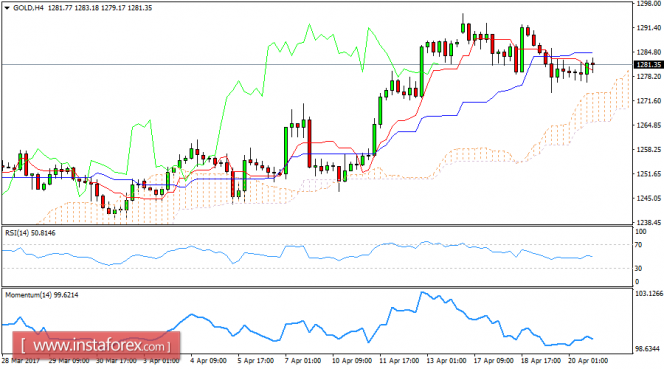
Gold is trading above 1,279.00 after the negative pressure that appeared yesterday. This keeps the chances for resuming the bullish trend. Importantly, the EMA50 continues to provide positive support for the price from below to protect ongoing trading within the bullish channel. This is displayed on the above chart. Therefore, the bullish trend will remain valid in the upcoming sessions. The targets begin at 1,300.00 and extend to 1,340.00. Let me remind you that breaking 1,263.17 will push the price down. In this case, the downward targets are seen at 1,250.00 and deeper at 1,228.50 before any new attempt to rise. The expected trading range for today is between 1,270.00 support and 1,300.00 resistance.
GOLDH4.png
 
Sponsored Post

Overview
Gold price keeps its stability above the EMA50 that forms good support base for the intraday trading. To enable trading inside the bullish channel displayed on chart, we are waiting until the bullish bias resumes. The first upward target is located at 1,300.00. Therefore, we will keep our bullish outlook unless 1263.17 is broken and holds below it. Breaking this level will push the price to visit the main bullish channel's support around 1,230.00 before any new attempt to rise. Please, note that breaching 1,300.00 will extend the bullish wave to reach 1,340.00. The expected trading range for today is between 1270.00 support and 1300.00 resistance.
GOLDH4.png
 
Overview
Gold price has settled at the critical support level of 1,263.17. Please note that stochastics is showing clear signals of oversold market consitions. This creates momentum that we await to encourage a further rise again. This keeps the bullish scenario valid in the short term. Be aware that breaking 1,263.17 and holding below it will push the price to decline and test levels from 1,250.00 and downward to 1235.00 before any new positive attempt. Our main upward targets begin at 1,300.00 extending to 1,350.00. Breaching 1,277.00 will ease the mission to achieve the suggested targets. The expected trading range for today is between 1,255.00 support and 1,290.00 resistance.
GOLDH4.png
 
Recently, the gold has been trading sideways at the price of $1,262.00. According to the 4H time frame, I found that the price rejected the key supply trendline. My advice is to watch for selling opportunities. I also found a bearish divergence on the moving average oscilator, which is another sign of weakness. Downward target is set at the price of $1,243.00.

Trading recommendations for today: watch for potential selling opportunities.
analytics5907365653faf.png
 
Overview
Gold price has fallen under more negative pressure to fluctuate below 1,230.00 barrier now. This supports ta further decline on the intraday basis. We are still waiting for the 1,211.31 level to be tested as the next main target. Please note that the EMA50 keeps supporting the expected bearish wave. Therefore, we are waiting for more declines in the upcoming sessions.

Be aware that breaking the target level will extend gold price losses to reach 1,172.70. The suggested decline will remain valid unless the price is able to breach 1,243.80 followed by 1,250.00 levels and hold above them. The expected trading range for today is between 1,211.30 support and 1,240.00 resistance.
GOLDH4.png
 
Recently, gold has been trading upward. The price tested the level of $1,225.65. Anyway, I found a false breakout of yesterday's high, which is a sign that buying looks risky. My advice is to watch for potential selling opportunities. I also found a reversal bar on the 30M time frame, which is another sign of weakness. The downward targets are set at $1,220.90 and $1.214.45.

Trading recommendations for today:
watch for potential intraday selling opportunities.
analytics5912fe684ad6d.png
 
Recently, Gold has been trading upwards. As I expected, the price tested the level of $1,237.34. Anyway, I still epxect higher price. Today I found an open and dive type of trading, which is a bullish session type. In the background, I found a broken trading range, which is another sign of strength. The price is also trading above 5-simple moving average. Watch for buying opportunities. Upwards targets are set at the price of $1,240.00 and $1,245.00.

Trading recommendations for today:
consider potential buying opportunities.
analytics591ae4fdce43b.png
 
Recently, Gold has been trading upwards. As I expected, the price tested the level of $1,265.05. The metal tested my yesterday's take profit level at $1,265.50. Anyway, today I found that price is having hard time to break above yesterday's high, which is a sign that downward correction is possible. My advice is to watch for potential selling opportuntiies. The downward target is set at the price of $1,249.00.

Trading recommendations for today: watch for potential selling opportunities.
analytics591d8890401ae.png
 
Recently, Gold has been trading downwards. The price tested the level of $1,246.00. According to the 30M time frame, there is a fake breakout of yesterday's low, which is a sign that sellers lost downward pressure. There is also a hidden bullish divergence on the ROC oscilator, which is another sign of strength. My advice is to watch for buying opportunities. The upward target is set at the price of $1,264.00.

Trading recommendations for today:
watch for potential buying opportunities.
analytics591eef92f1082.png
 
Recently, the gold has been trading downwards. As I expected, the price tested the level of $1,248.00. Anyway, on the 15M time frame, I found a fake breakout of the yesterday's low at the price of $1,249.80. There is also a hidden bullish divergence on the moving average osiclator, which is another sign of potential strength. My advice is to watch for buying opportunities. I have placed Fibonacci retracement to find potential upward targets. I got Fibonacci retracement 50% at the price of $1.255.55 and Fibonacci reracement 61.8% at the price of $1,257.40. The final target is set at $1,262.50.

Trading recommendations for today: watch for potential buying opportunities.
analytics5925645de126f.png
 
Status
Not open for further replies.
Sponsored Post

Live Forex Chart

Currency
Rates
EUR / USD
1.06532
USD / JPY
154.623
GBP / USD
1.24489
USD / CHF
0.91182
USD / CAD
1.37647
EUR / JPY
164.722
AUD / USD
0.64286

CG Sponsors


Back
Top
Log in Register