InstaForexRebat
CG Hardcore Club

- Messages
- 58,370
- Joined
- Nov 9, 2008
- Messages
- 58,370
- Reaction score
- 5,557
- Points
- 721
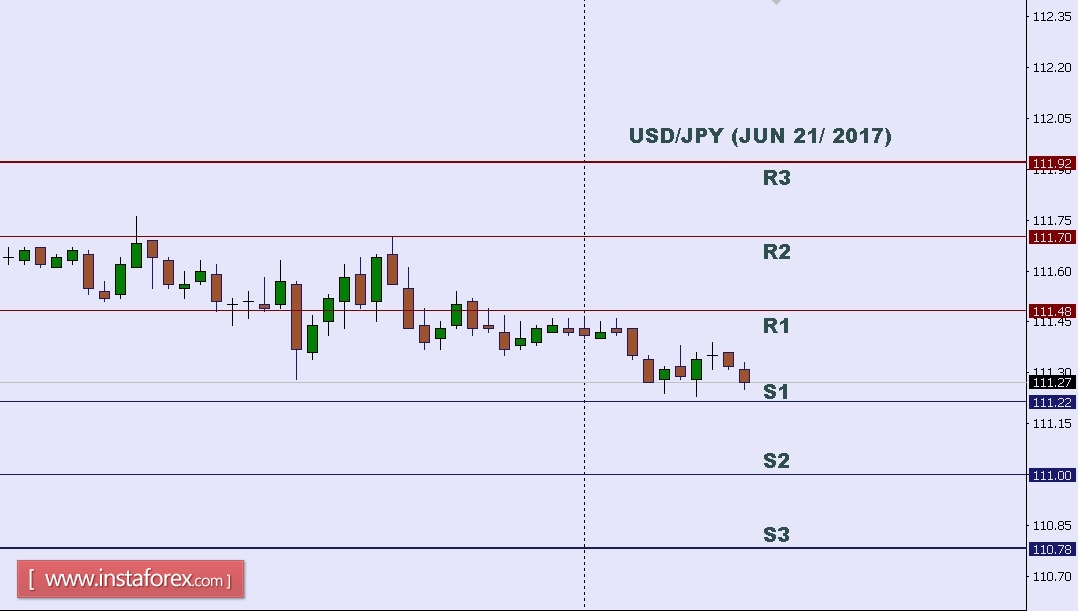
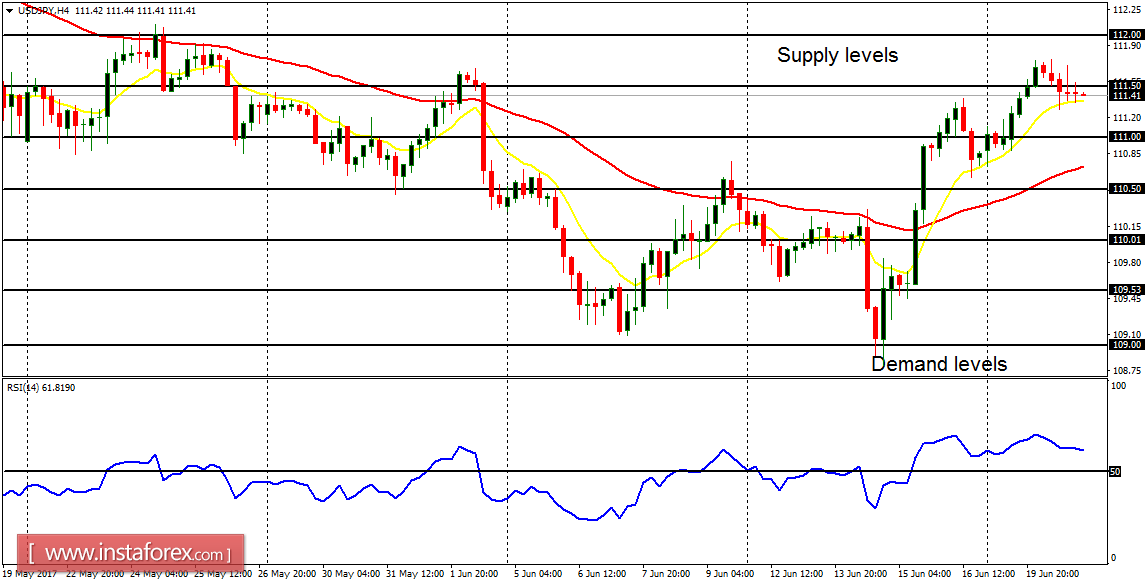
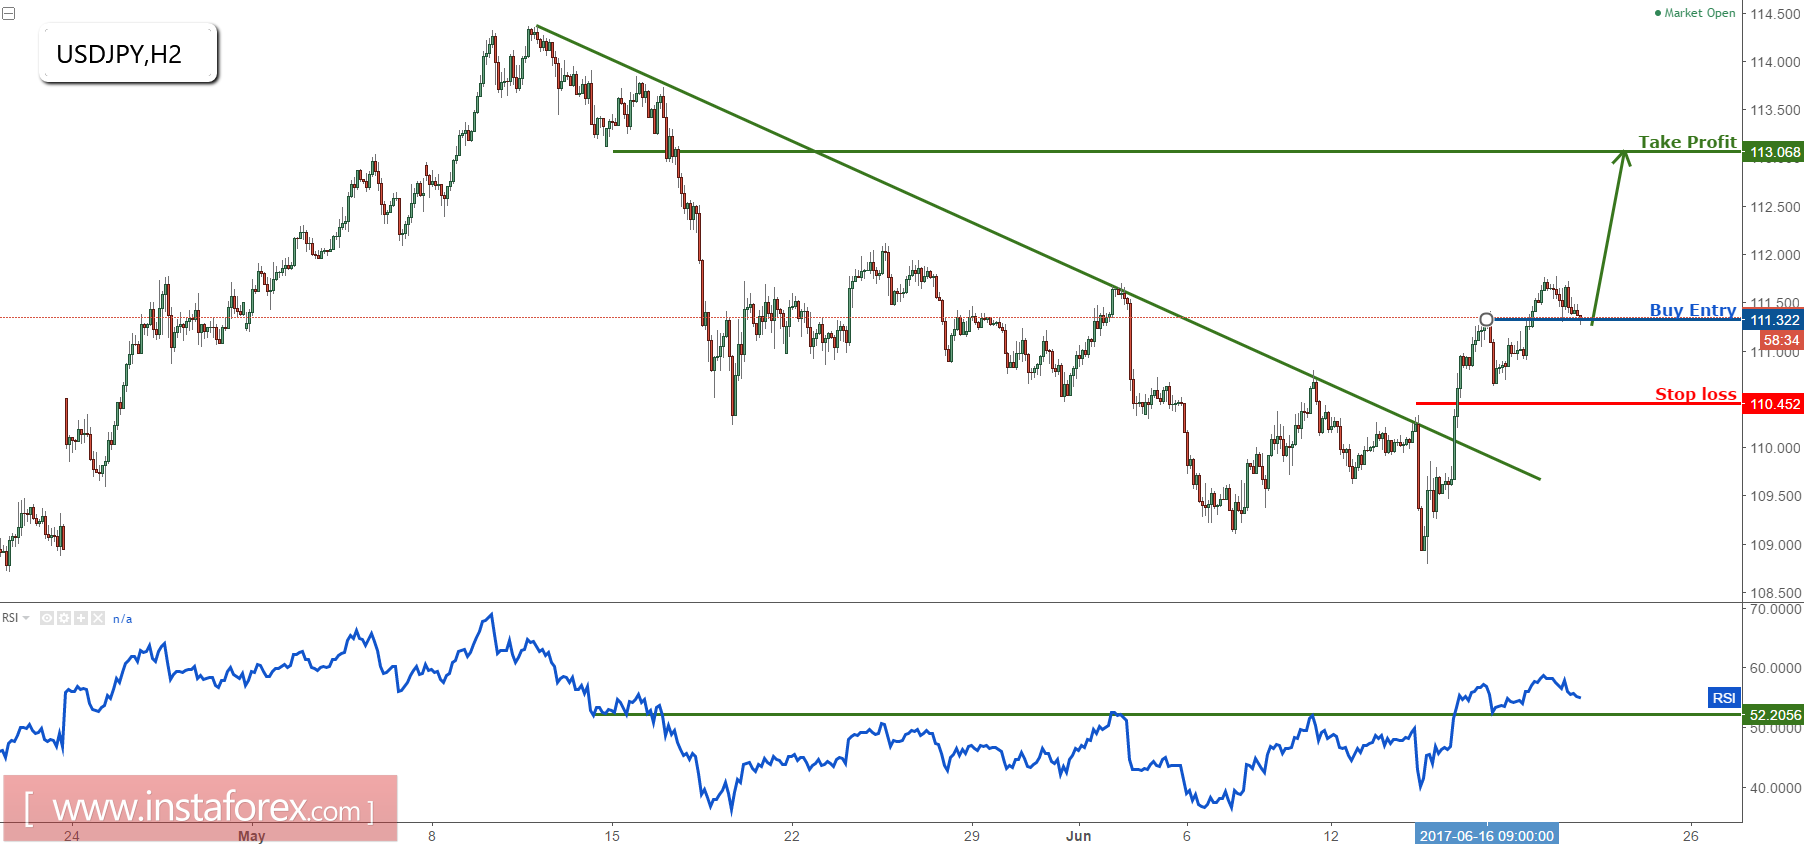
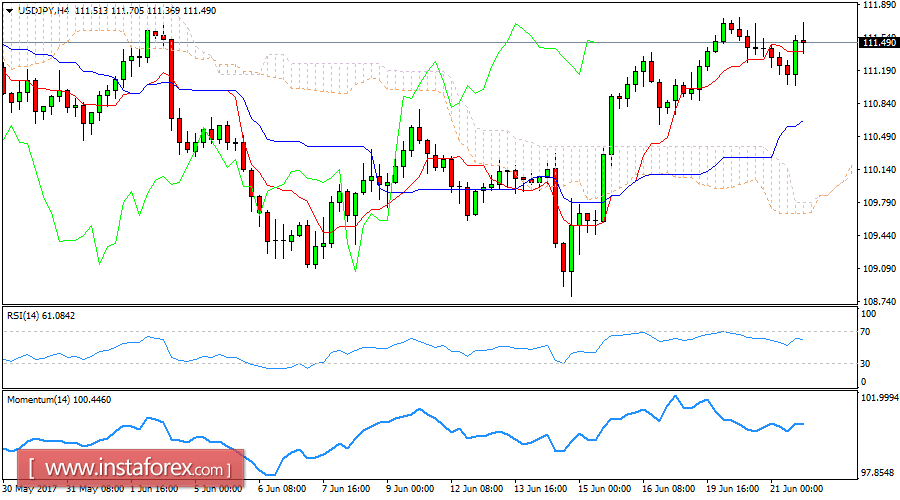
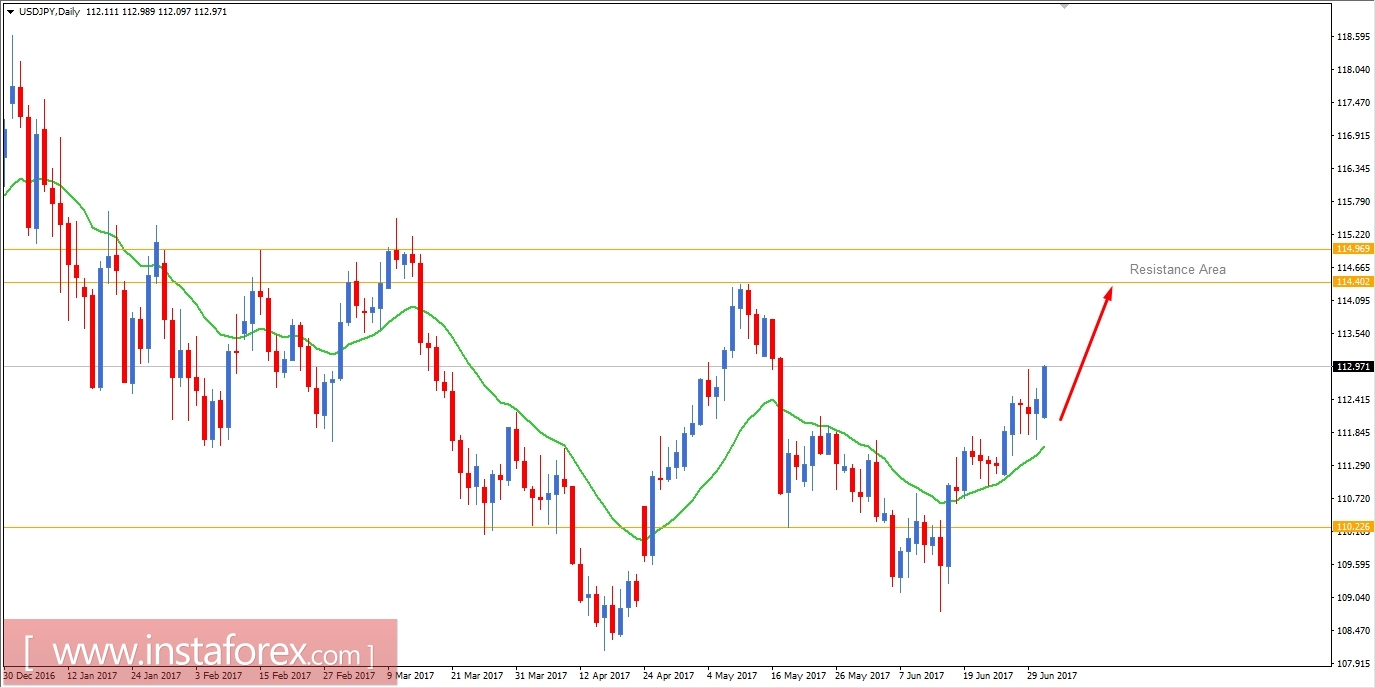
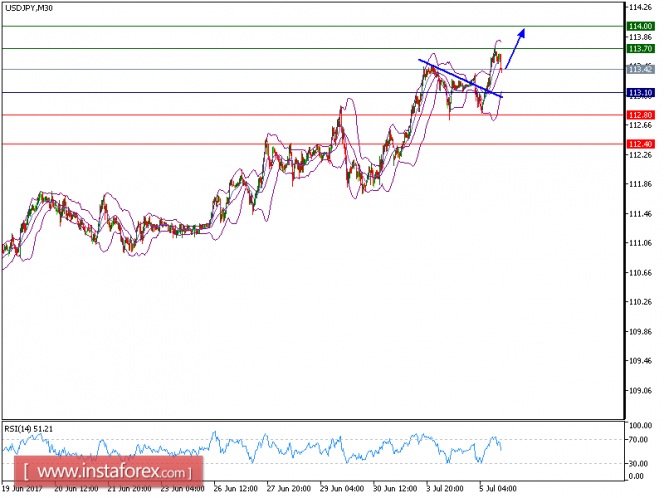
USD/JPY approaching profit target perfectly, remain bullish for a further rise
Price has bounced up perfectly from our buying area yesterday and is on track to reaching our profit target.
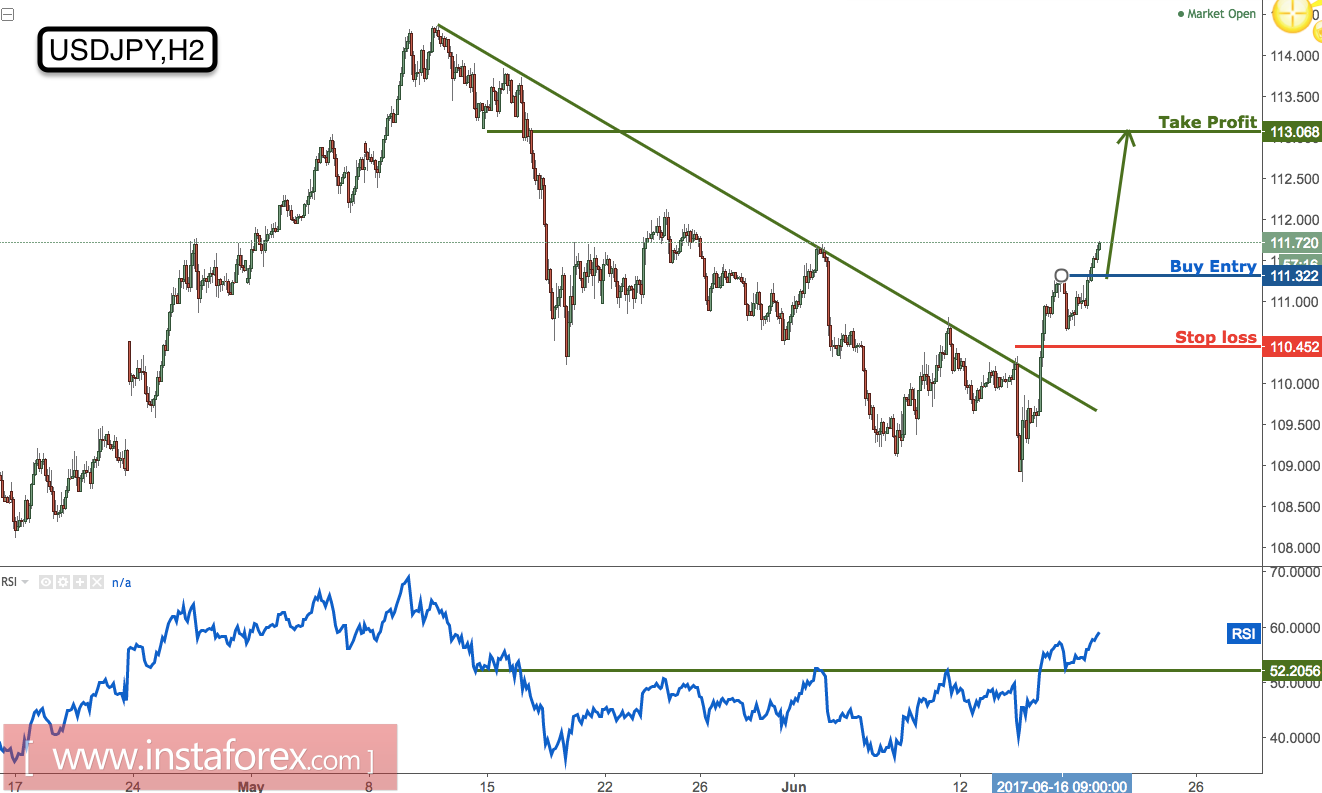
We remain bullish looking to buy on dips above 111.32 support (Fibonacci retracement, horizontal pullback support) for a further push up to at least 113.06 resistance (Fibonacci extension, Fibonacci retracement, horizontal pullback resistance).
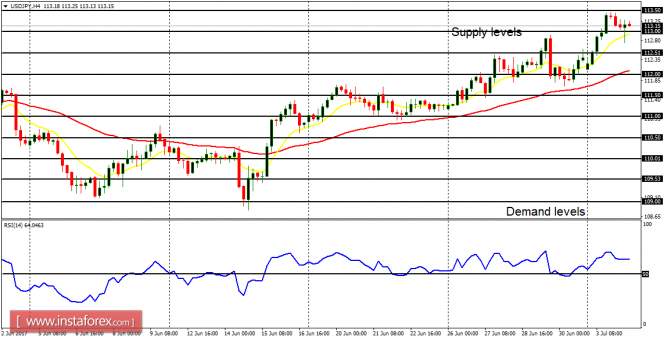
RSI (34) has bounced off nicely from our pullback support at 52% and has good upside potential for us to play the rise from here.
Buy above 111.31. Stop loss at 110.45. Take profit at 113.06.
https://www.instaforex.com/forex_analysis/93182/
Price has bounced up perfectly from our buying area yesterday and is on track to reaching our profit target.
We remain bullish looking to buy on dips above 111.32 support (Fibonacci retracement, horizontal pullback support) for a further push up to at least 113.06 resistance (Fibonacci extension, Fibonacci retracement, horizontal pullback resistance).
RSI (34) has bounced off nicely from our pullback support at 52% and has good upside potential for us to play the rise from here.
Buy above 111.31. Stop loss at 110.45. Take profit at 113.06.
https://www.instaforex.com/forex_analysis/93182/
Last edited: